Зарегистрируйтесь сейчас для лучшей персонализированной цитаты!


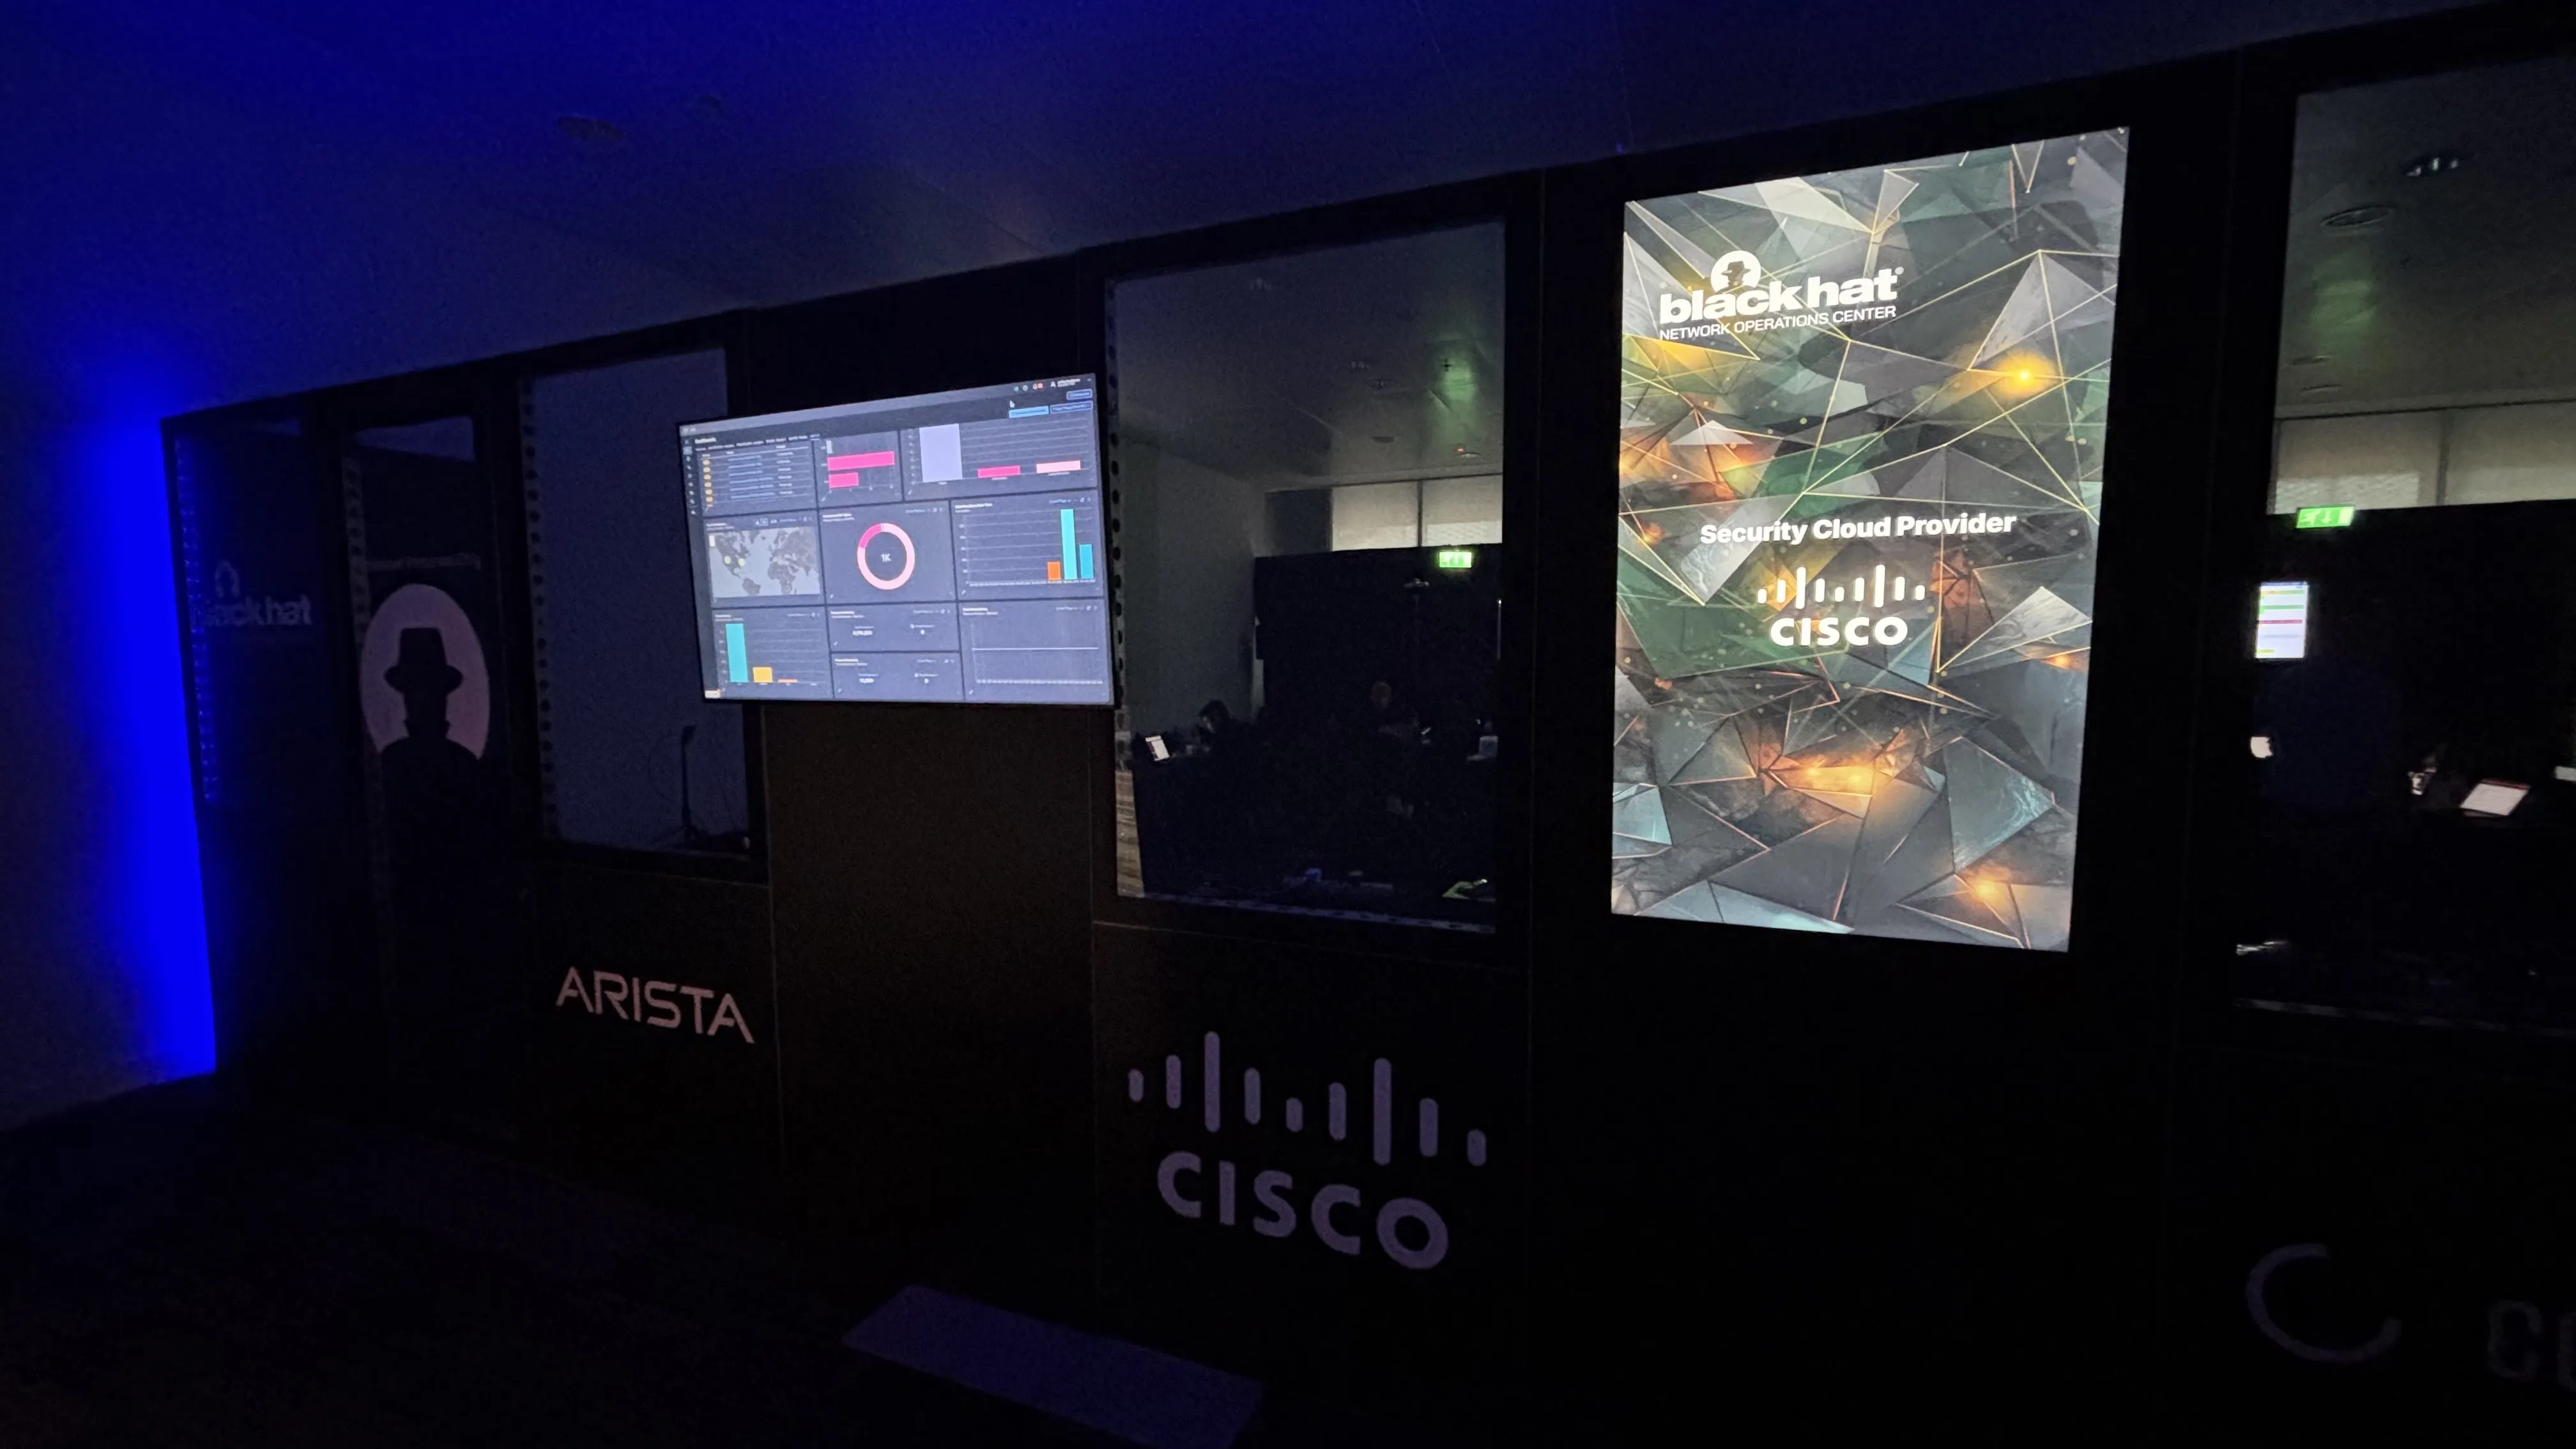
Cisco is the Official Security Cloud Provider for the Black Hat Network Operations Center (NOC). We work with the other official partners to bring the hardware, software and engineers to build and secure the network, for our joint customer: Black Hat.
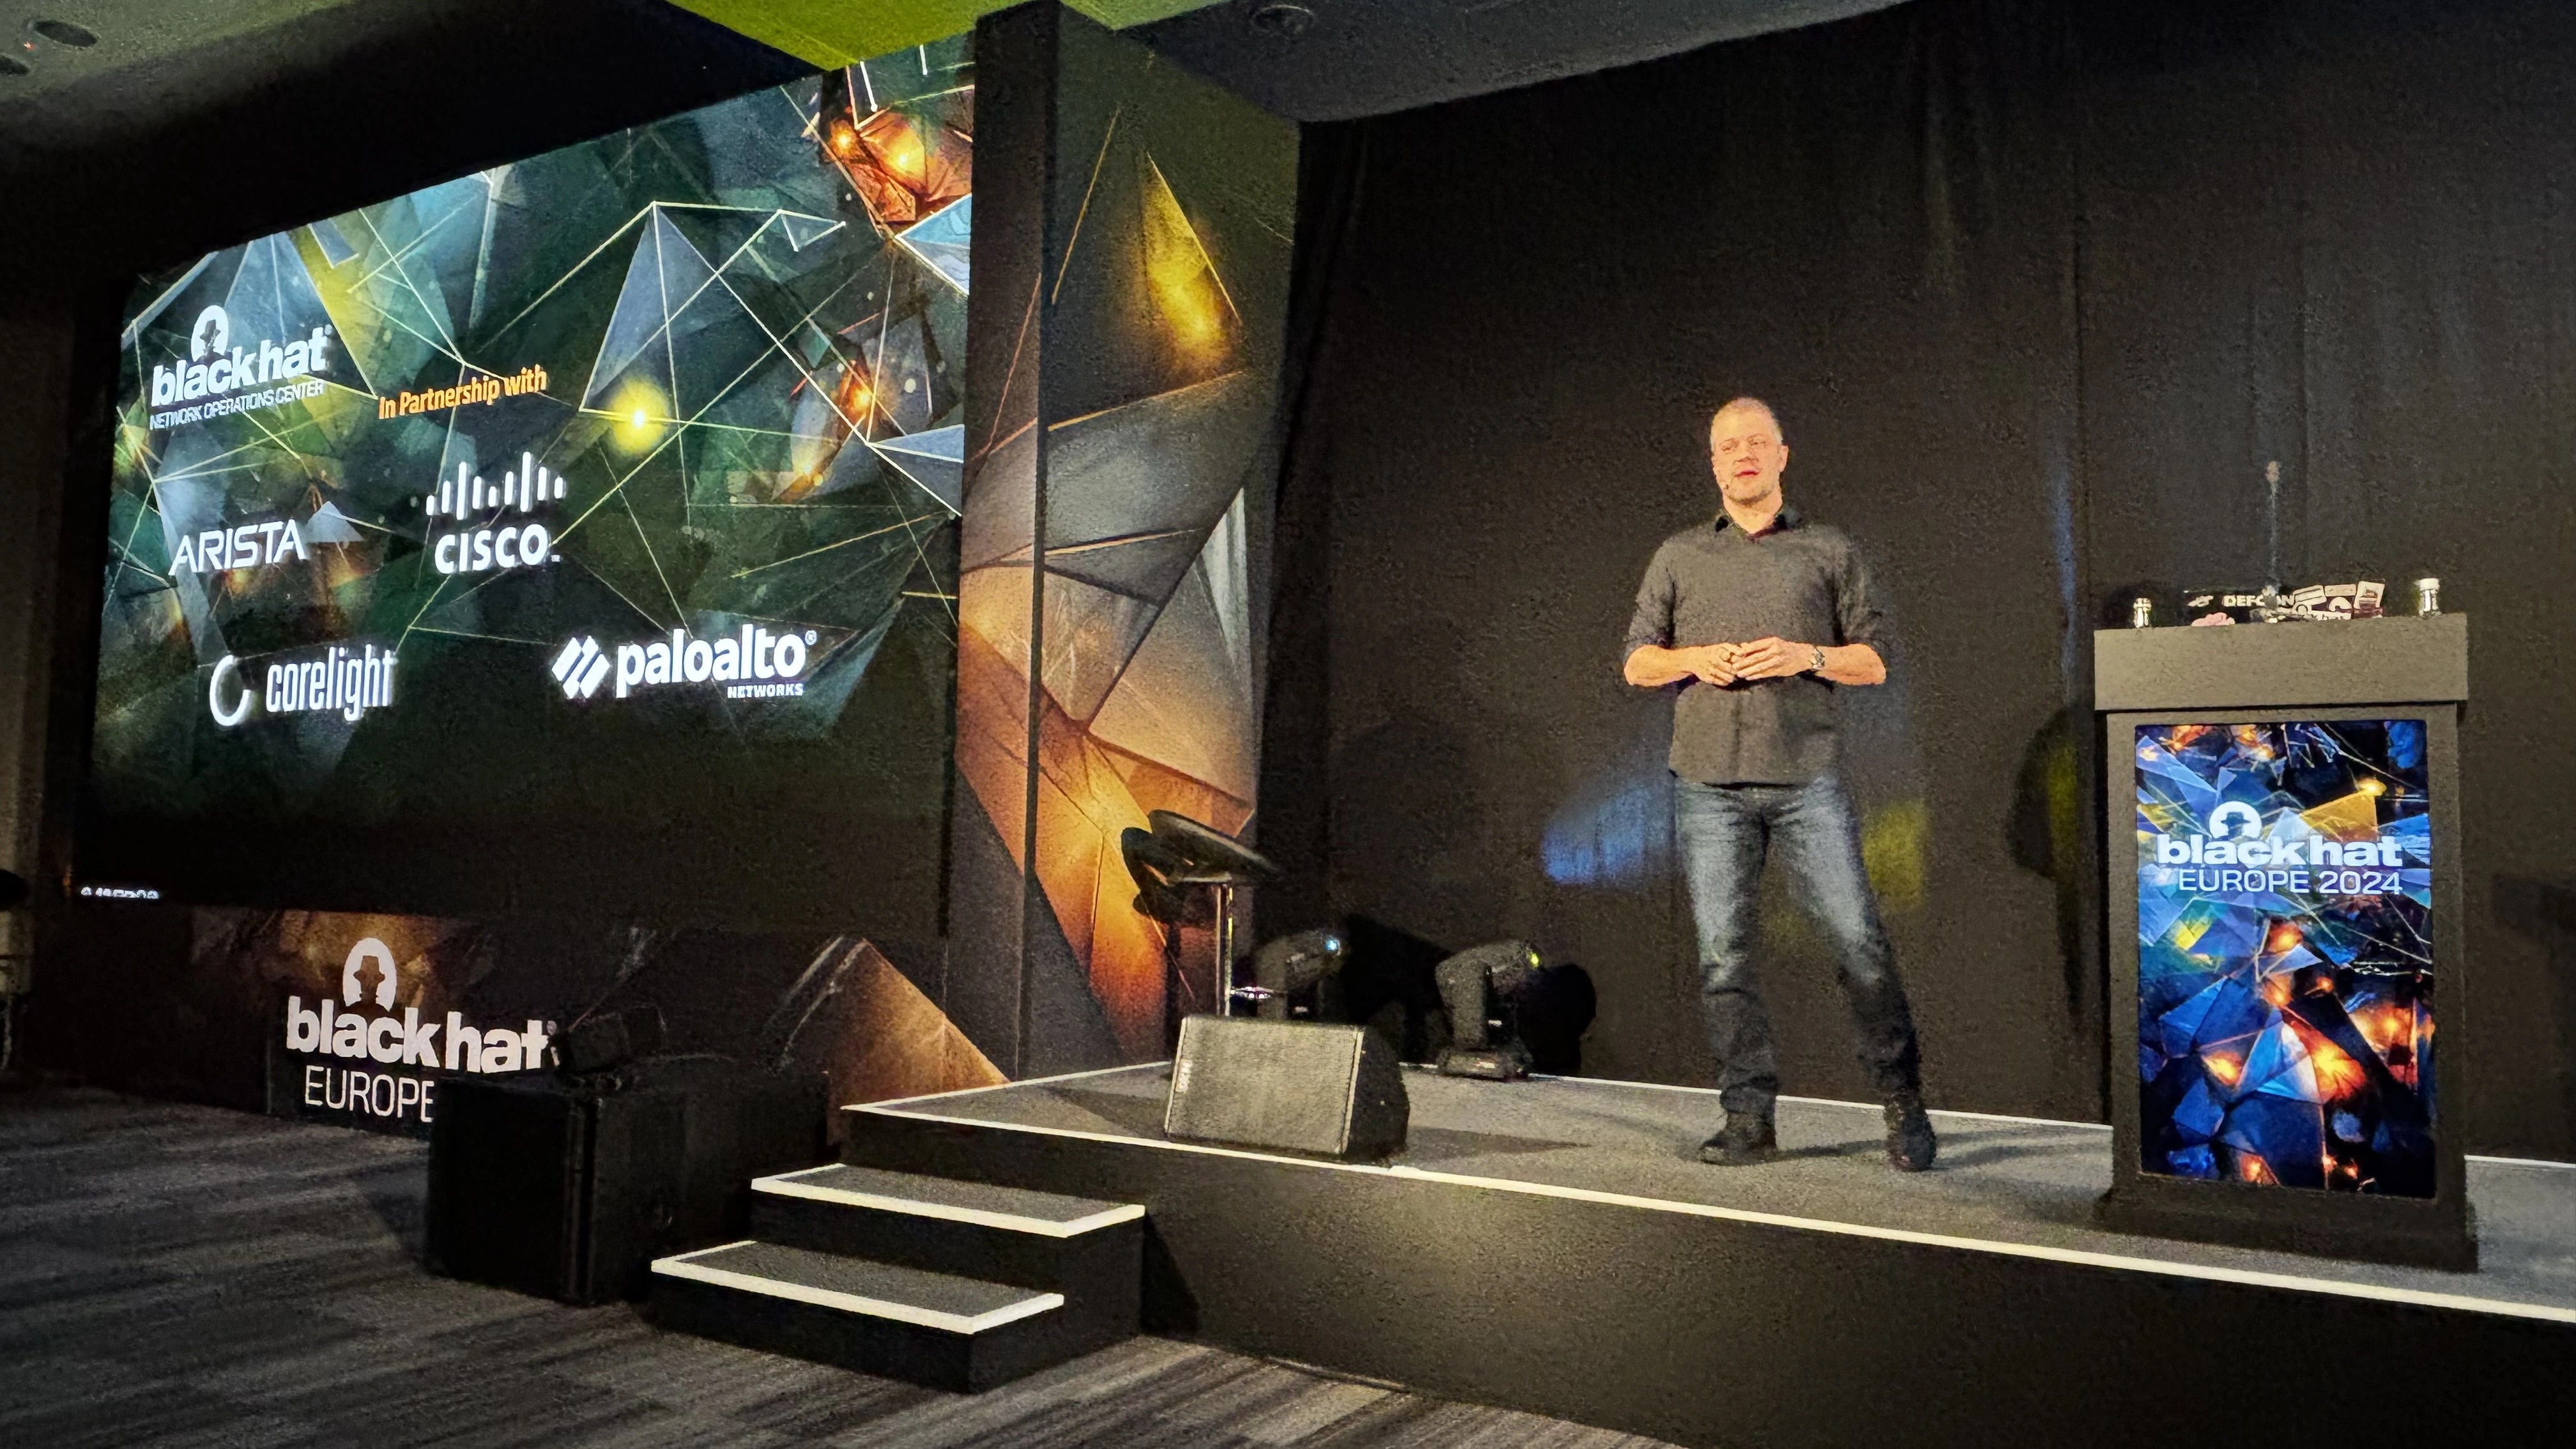
This was our 8thyear supporting Black Hat Europe and the primary mission in the NOC is network resilience. Thepartners also provide integrated security, visibility and automation, a Security Operations Center (SOC) inside the NOC.
When the partners deploy to each event, we set up a world class network and security operations center in a few days. Our goal remains network up time and creating better integrated visibility and automation. Black Hat has the pick of the security industry tools and no company can sponsor/buy their way into the NOC. It is invitation only, with the intention of diversity in partners, and an expectation of full collaboration. As a NOC team comprised of many technologies and companies, we are continuously innovating and integrating, to provide an overall cybersecurity architecture solution.
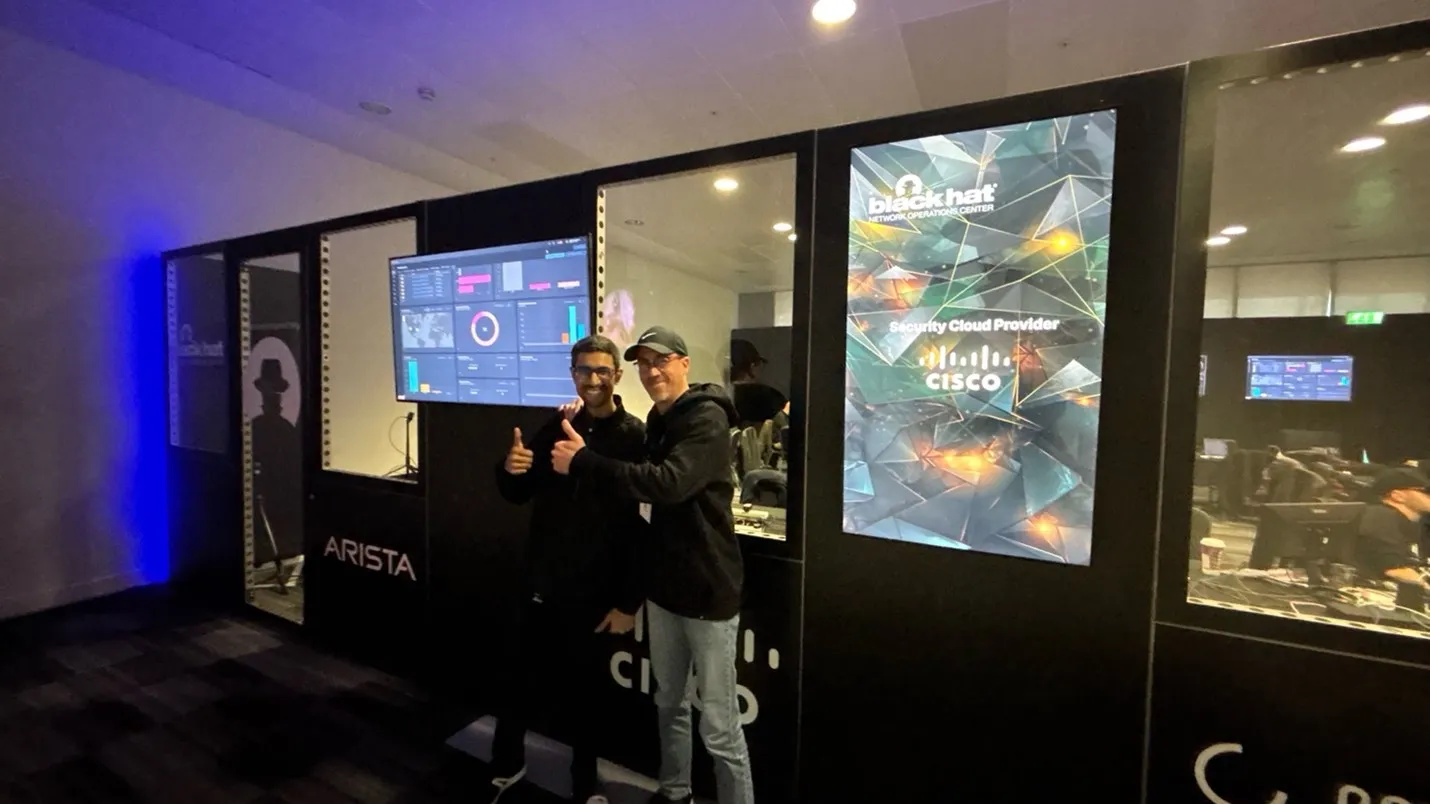
Outside the NOC partner dashboards were displayed for the attendees to view the volume and security of the network traffic.
The role of Cisco in the Black Hat NOC continues to evolve since we were invited to partner in 2016. Black Hat has unlimited access to the Cisco Security Cloud and its capabilities. Working with the NOC leaders (Neil "Grifter" Wyler & Bart Stump) and the chief architect (Steve Fink), we tested, deployed and integrated the following technologies:
Breach Protection Suite
User Protection Suite
ThousandEyes: Network visibility
The NOC leaders allowed Cisco (and the other NOC partners) to bring in additional software to make our internal work more efficient and have greater visibility; however, Cisco is not the official provider for Extended Detection and Response (XDR), Security Incident and Event Management (SIEM), Network Detection and Response (NDR), Security Operations and Automated Response (SOAR) or collaboration.
To better support Black Hat, we also implemented:
Cisco Duo is a new addition to the Black Hat NOC. We started with a Proof-of-Concept (PoC) in Black Hat Asia 2024 and turned it into a full deployment at Black Hat Europe. With this deployment, our goal was to create an environment where each partner would have a single sign-on (SSO) user to log into each product provided by a partner. We would create groups for each user, which mapped to being an analyst, administrator or an approver role.
As an example, if we wanted to use Palo Alto Networks (PANW) XSIAM product, we could log in with our user, but they would only be an analyst and could not make changes on the platform. However, if a PANW admin logged in, they could make changes as needed. This was vice versa for them as well, the PANW admins would be analysts within our Cisco products, but we could make changes as necessary on our own products, in coordination and approval of NOC Leaders.
We were able to integrate Duo SSO into the following partner products:
Most of these integrations were for on-prem products (not publicly available) and a few were cloud-based, showing that we are able to protect an application whether it is publicly available or private. The Cisco products already had an SSO architecture with our corporate accounts and we will transition to the Black Hat SSO infrastructure for Asia 2025.
After getting all the Duo applications setup, we were able to start getting authentication requests into Duo:
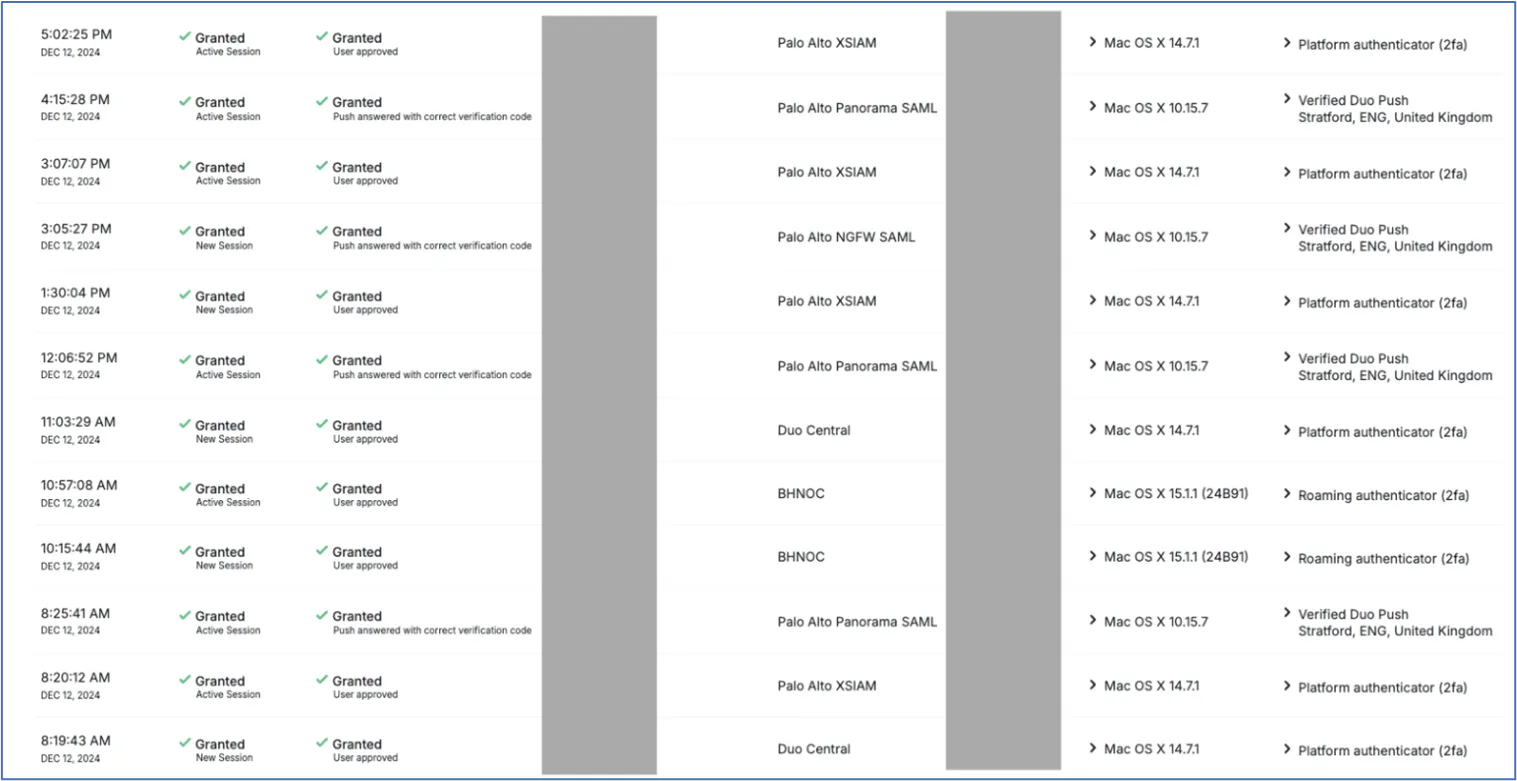
Below, you can see all the applications we created to integrate Duo SSO.

After the applications were configured and the users enrolled in Duo, we were able to start using the new Cisco Identity Intelligence, from within Duo.
Cisco Identity intelligence (CII) is an AI-powered solution that bridges the gap between authentication and access. It allows us to bring in multiple authentication source logs into a single entity and then analyze them to determine if a user is trustworthy. CII will give a user a trust score based on geographic location, login times, Operating System (OS), device types, number of login attempts, correct and incorrect logins, device trust and many more criterion. CII takes all these indicators into account and then makes trust levels for each user. You can see our trust score spread in the below screenshot:
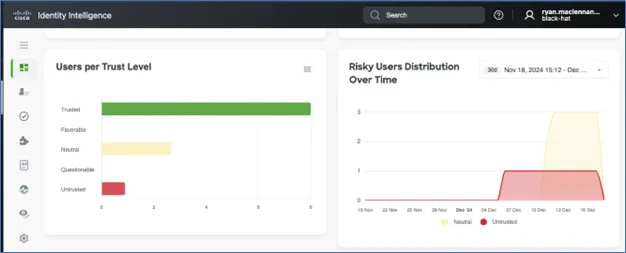
You can see in the screenshot above that there was an untrusted user, three neutral, and nine trusted users. Many of the neutral users were because CII didn't have enough data to baseline the user yet and was still determining how it should classify them. The one untrusted user was me; because the user I used to administer Duo and CII was the same that I used login with to all the other applications.
Before the London based conference, I was administering Duo and CII in the United States. I then used a VPN a few times while in Europe, so my geography was quickly changing. These events contributed to my 'Untrusted' status, worthy of investigation.
Below, we can see the dashboard view of CII, with the quick view of information which an administrator may be interested in seeing.
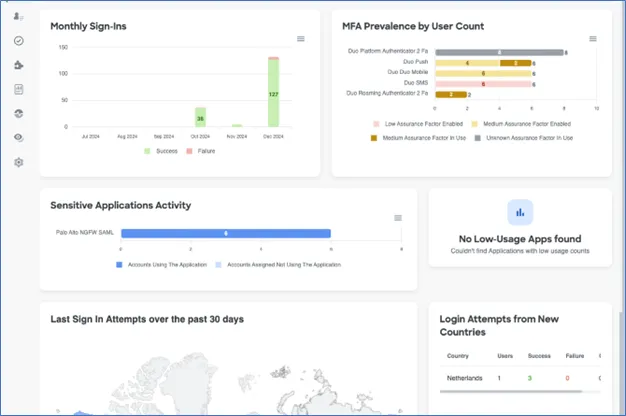
In the above screenshot, we can see the monthly sign-ins and whether they were successful or not. Also, the type of Multifactor Authentication (MFA) used by users, sensitive applications and the countries where logins were attempted from.
As the Black Hat conference global circuit continues, I am excited to see where we can take CII and use its data to better secure our NOC partner products.
For Cisco, a core integrated function in the Black Hat NOC/SOC is providing the platform for our partners to send suspicious files to Secure Malware Analytics (aka Threat Grid) for dynamic malware analysis (aka sandboxing). We have expanded the integration over the years, with both Corelight OpenNDR and Palo Alto Networks Firewalls submitting samples. At Black Hat Europe 2024, over 12,000 supported samples were submitted.
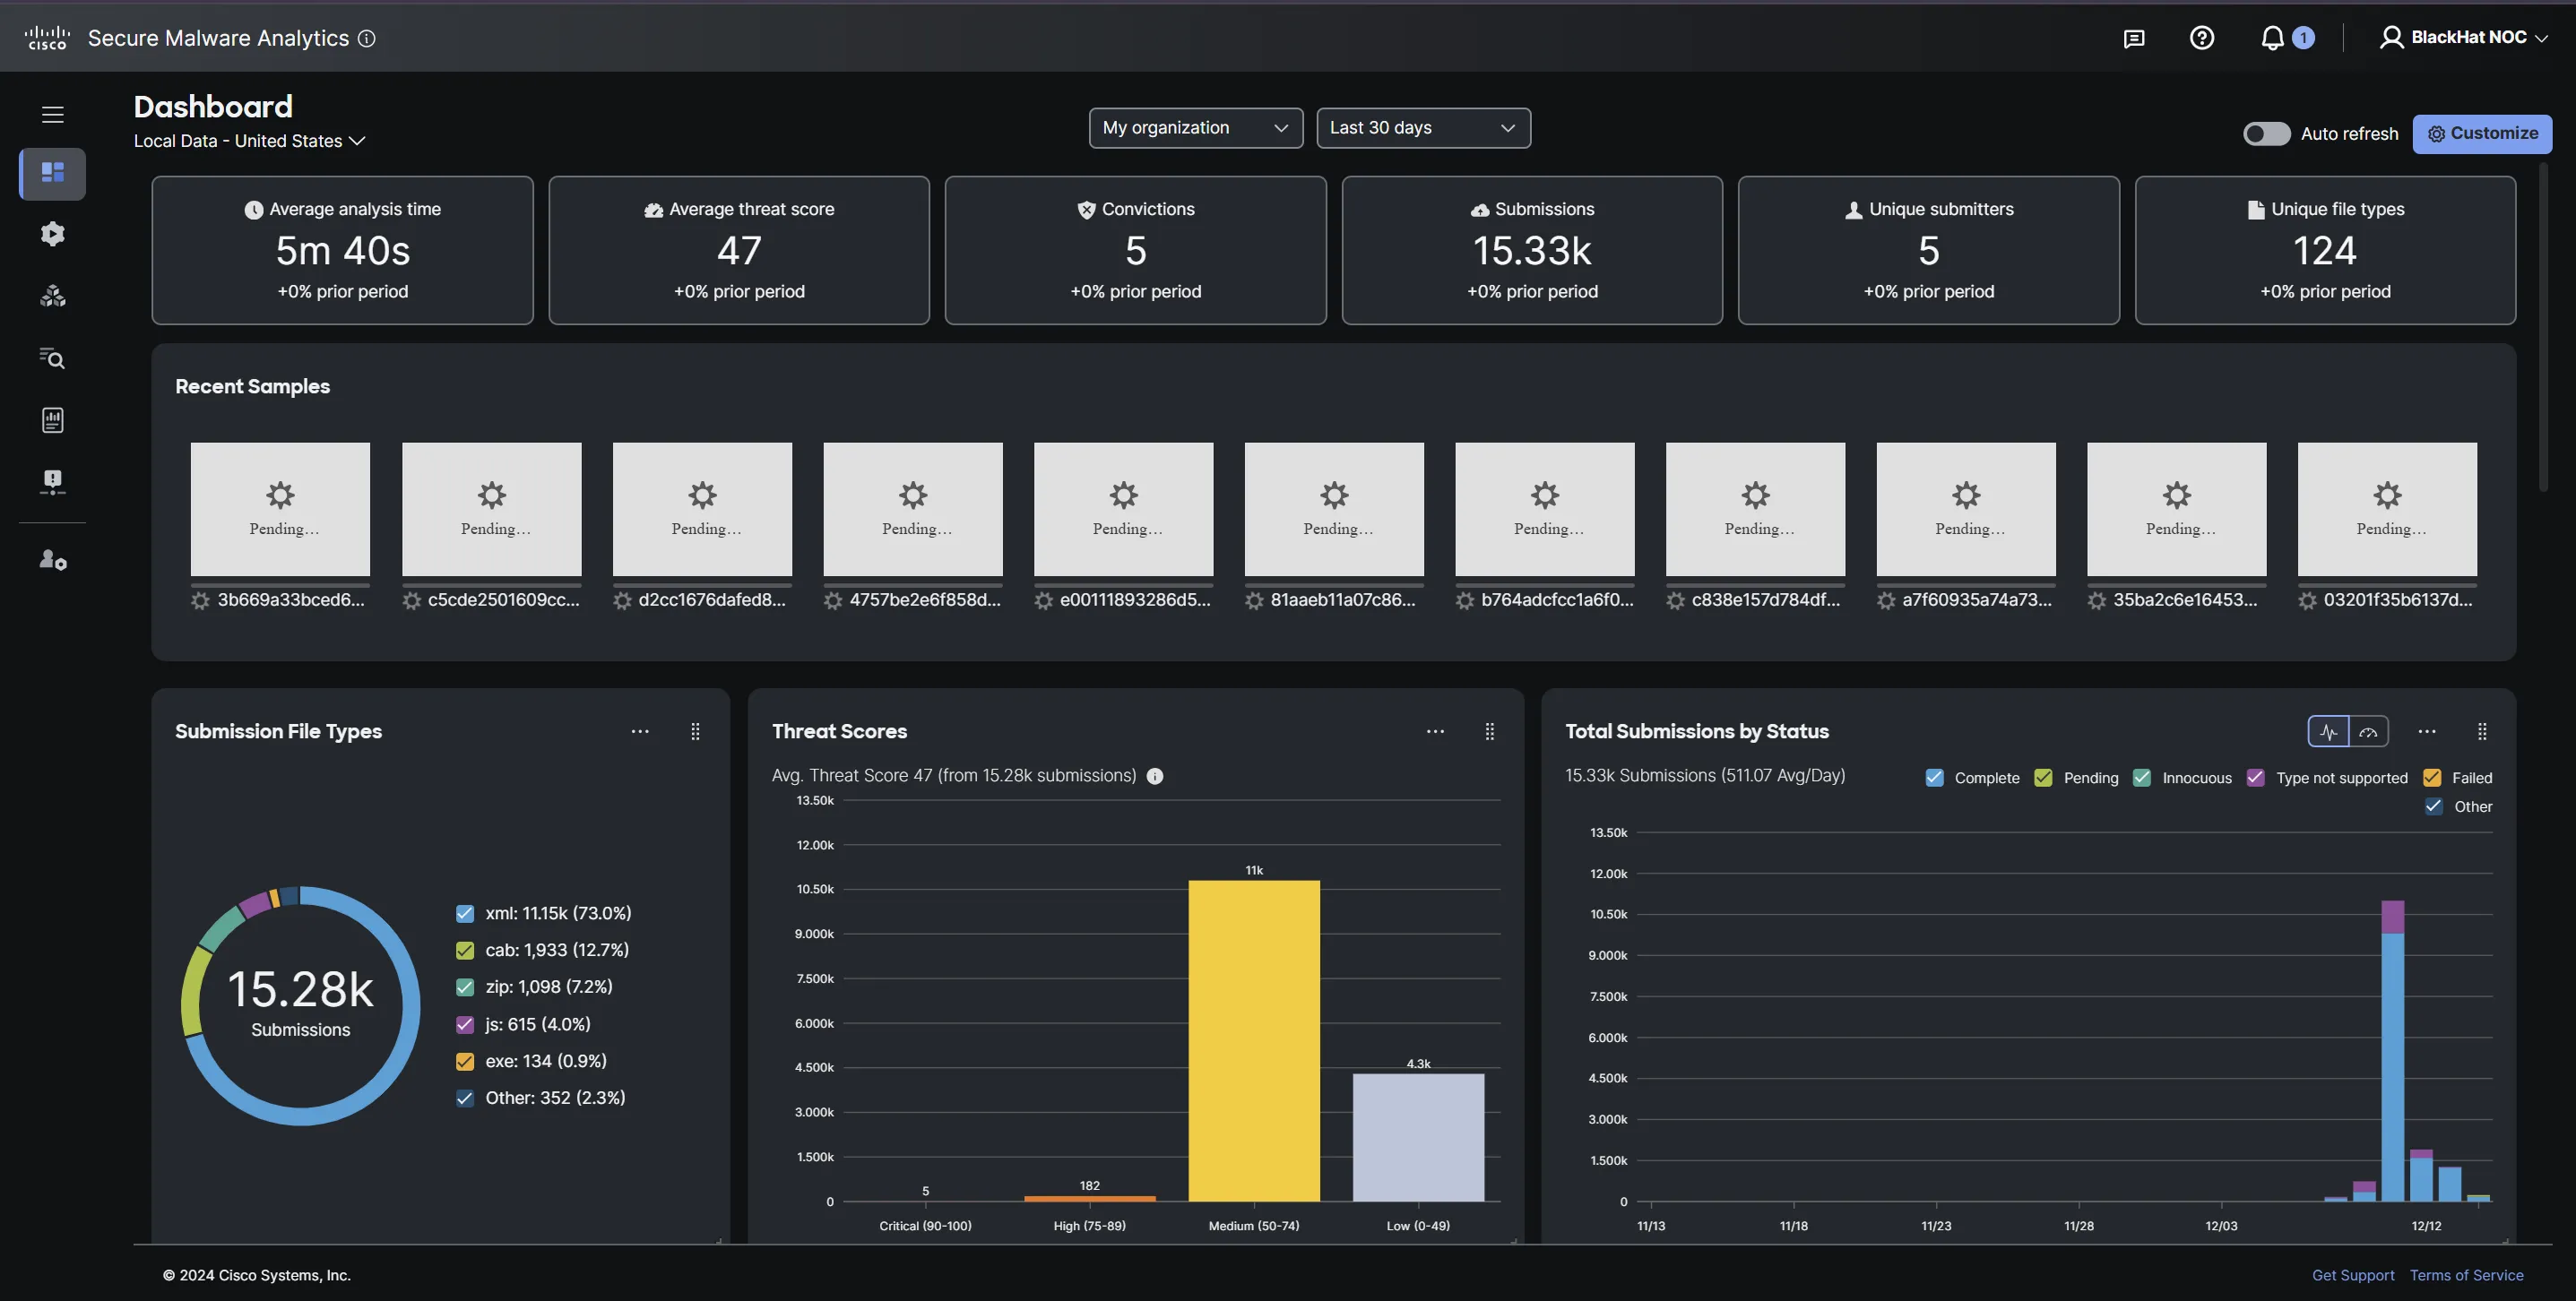
The threat hunters also used Secure Malware Analytics to investigate suspicious URLs and files, without the risk of infection. Most of the convictions were on URLs submitted by the NOC analysts.
At each conference, we see examples of personal identifying information sent over the network in the clear. One that stood out was a college student's transcript in clear text. This is what happens when you use http on port 80 for communications (instead of https). The following details of the student were clearly available from the contents downloaded from the self-hosted domain:
...and that is all you need to craft an identity theft and/or phishing attack on the unassuming student. Always verify your connection security!
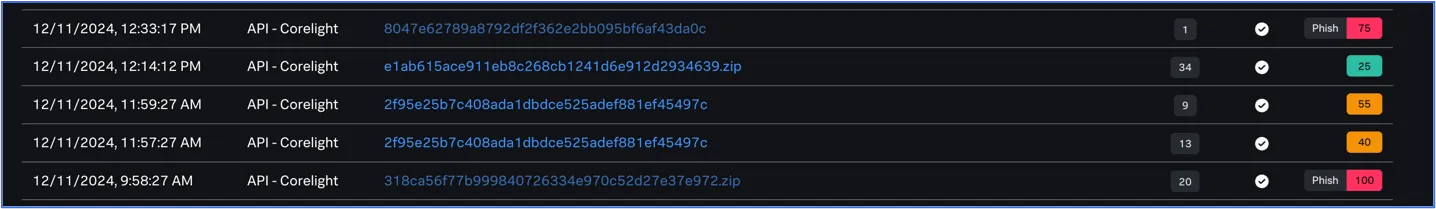
As a PoC at Black Hat USA, we deployed Splunk Attack Analyzer (SAA) as another malware sandboxing tool. This was a new integration created with the help of the Corelight team and was made on the spot. This time around in Europe, we were able to enable all of SAA's capabilities and sent all files to it to match with Secure Malware Analytics. Here is dashboard summary of the files analyzed by SAA:
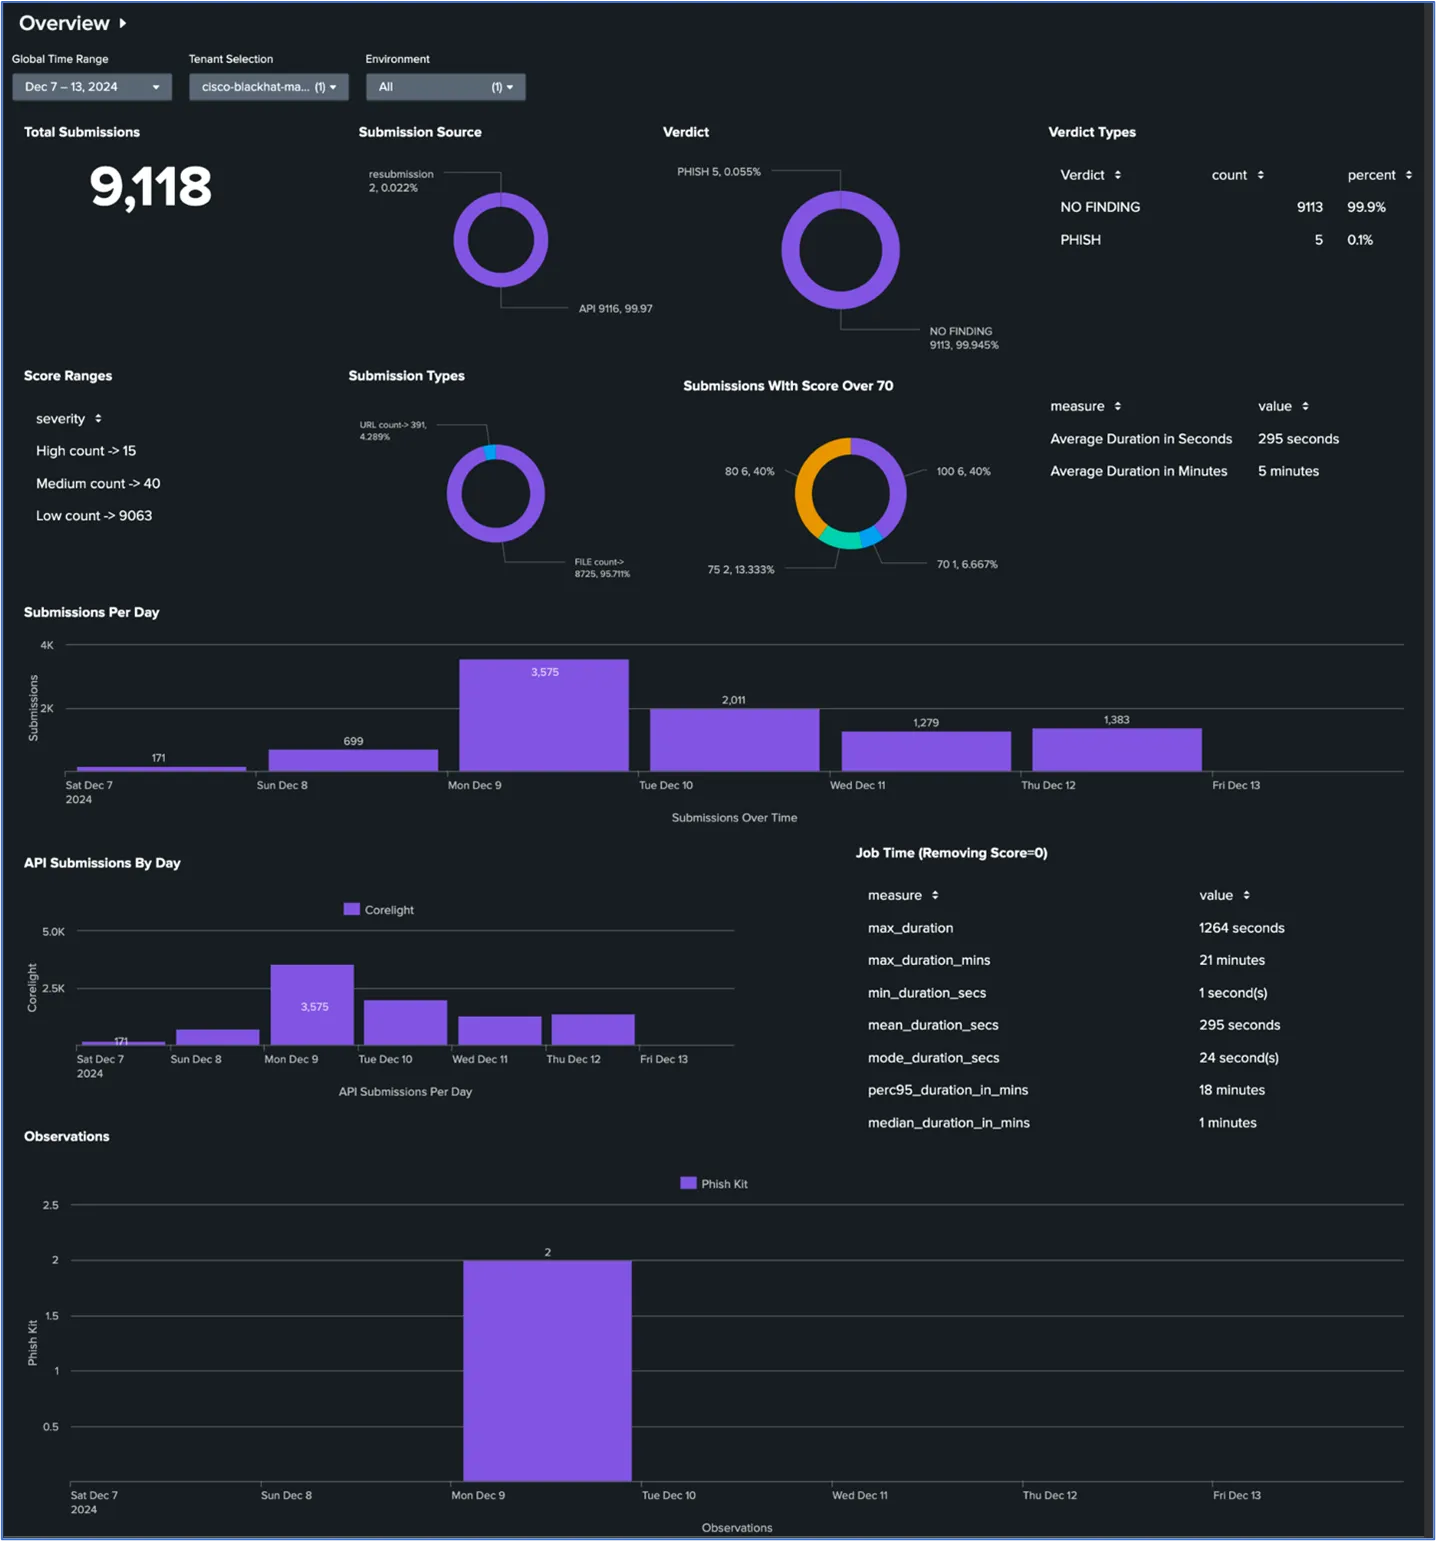
Looking at this we can see the total amount of files analyzed by SAA and what was convicted as malicious. Of the convictions we got, we found that two were Phish Kits.
You may have noticed that Secure Malware Analytics analyzed thousands more files than SAA. This is because we started to hit a rate limit, and our SAA instance didn't catch it in time. For the next conference, we will be working with Corelight to make the integration more robust to handle the rate limiting efficiently.
In case you missed it, SAA now has Secure Malware Analytics (SMA) as an engine. This means, when you link your SMA account to SAA, SAA will now send files to be analyzed by SMA as well and use its determination as part of its own scoring.
The Cisco XDR Command Center dashboard tiles made it easy to see the status of each of the connected Cisco Secure technologies, and the automation workflows iterations over the week.
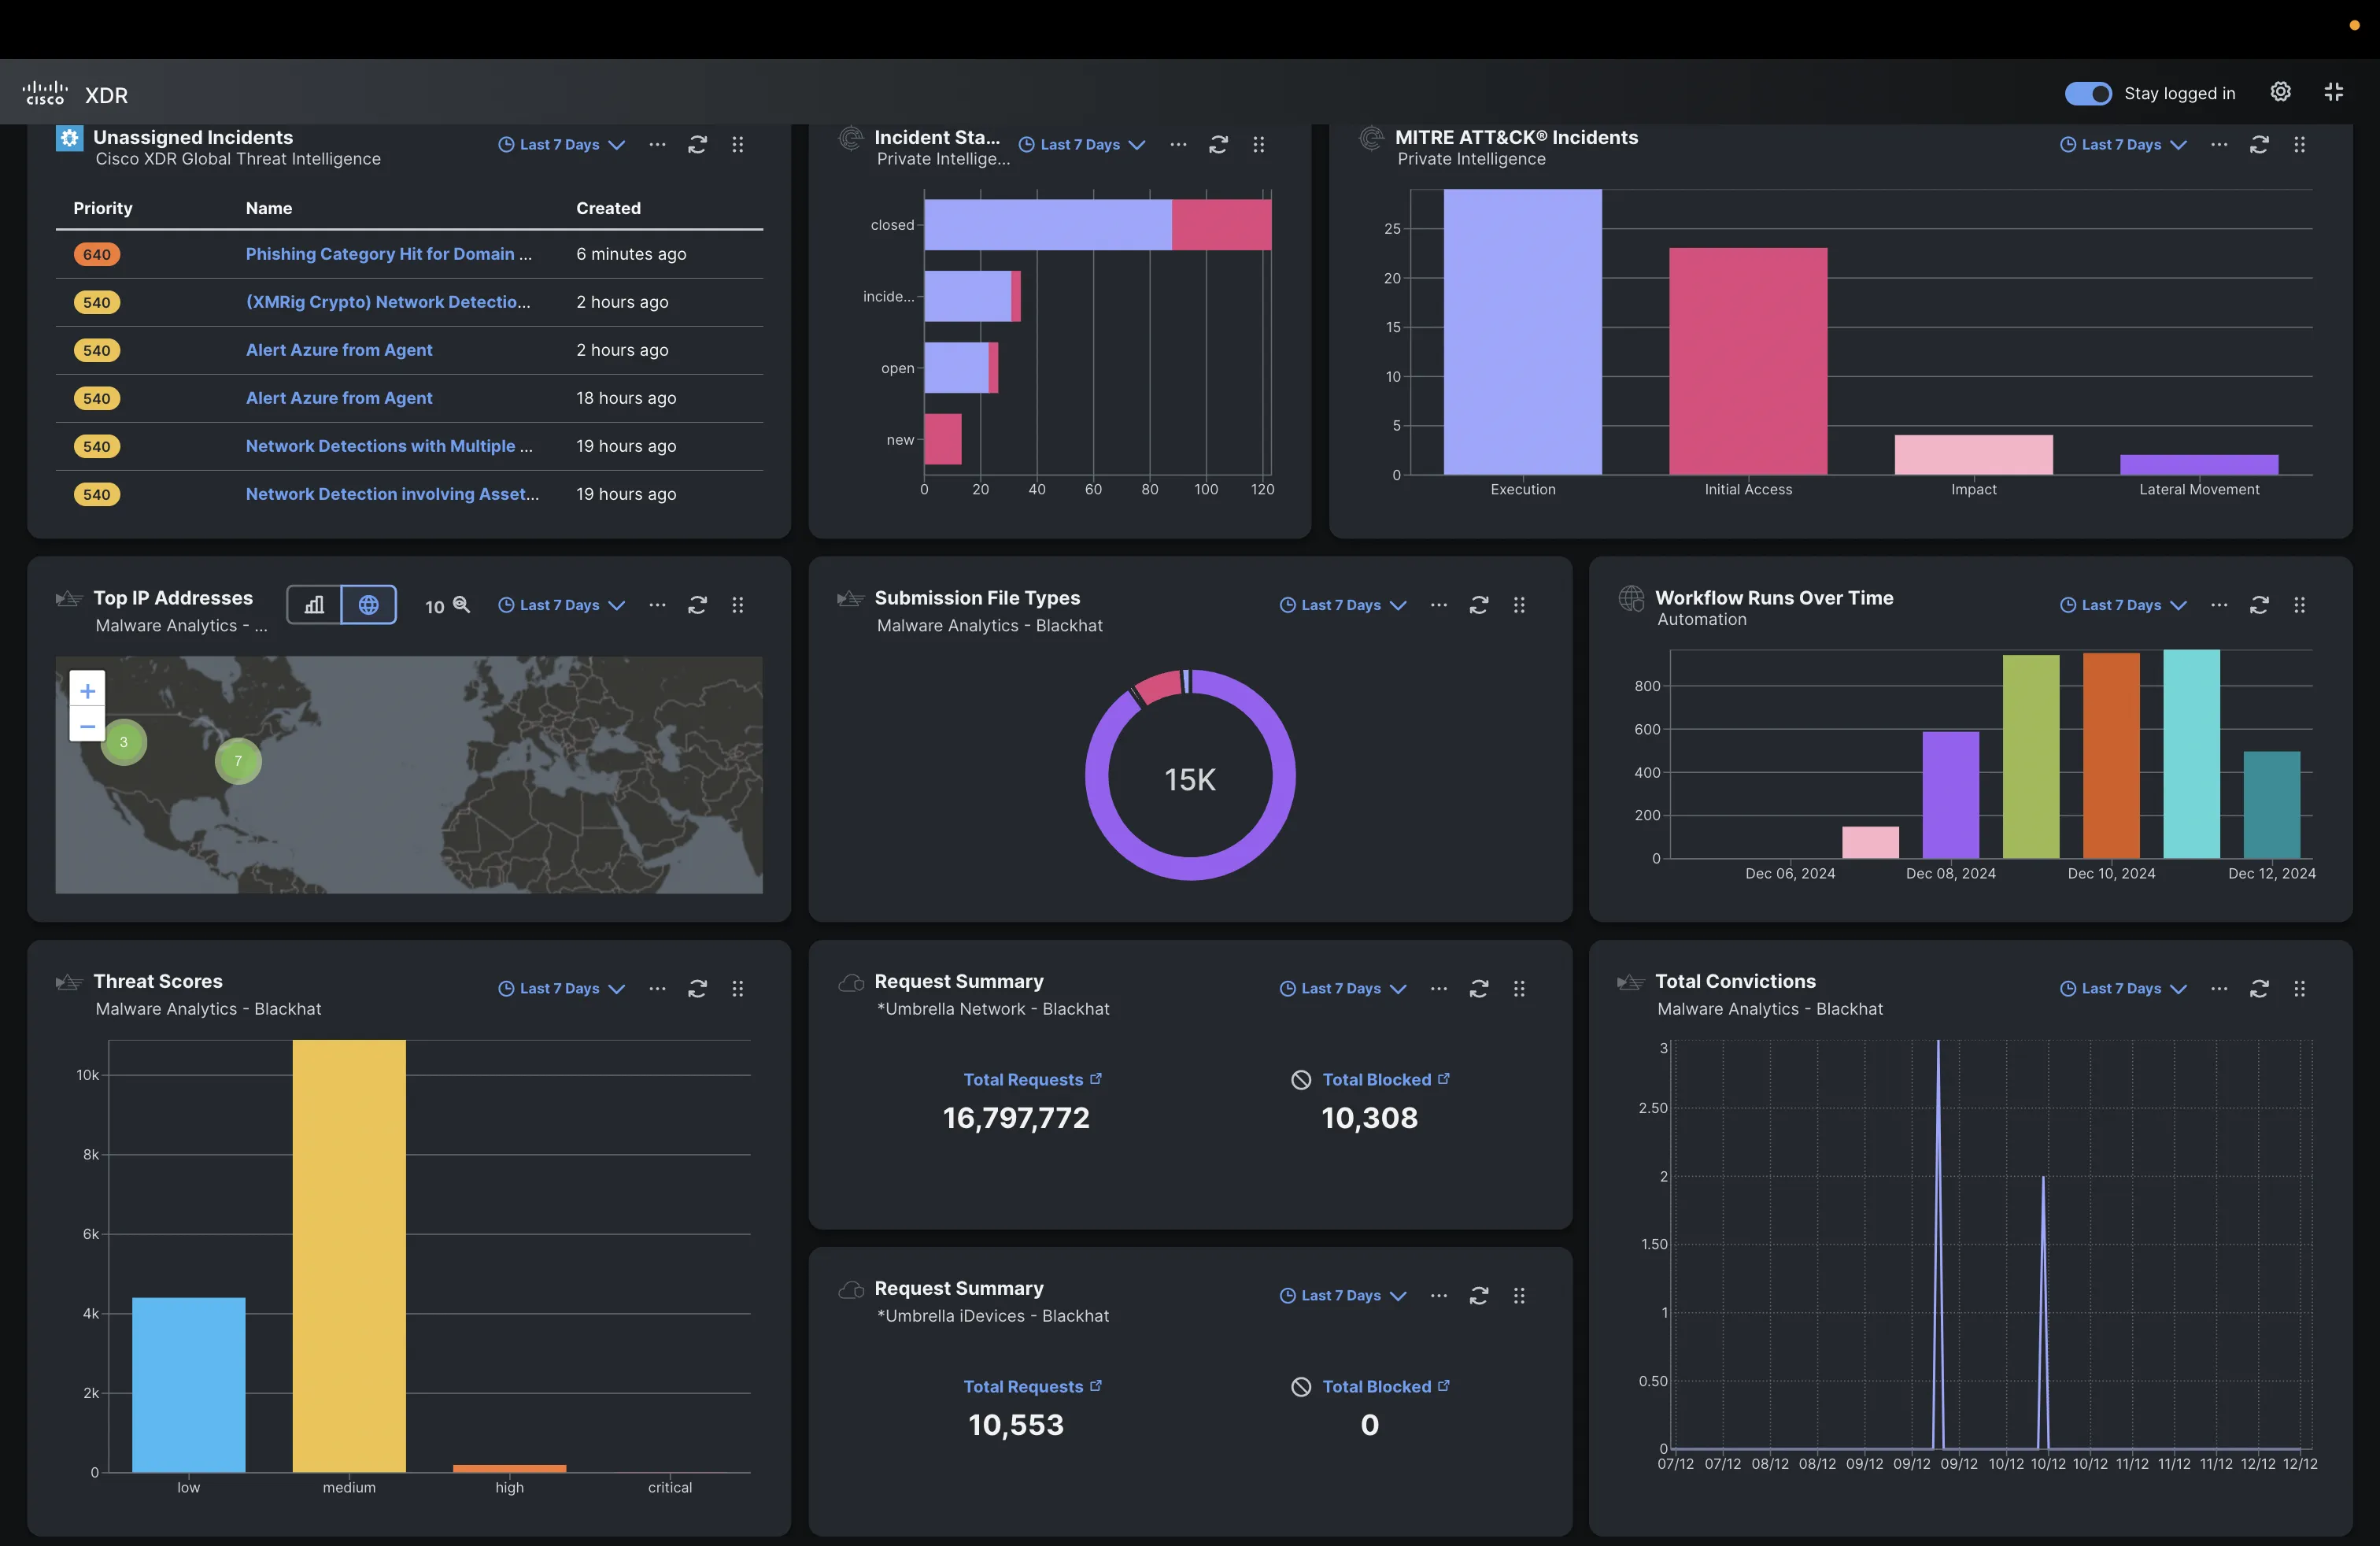
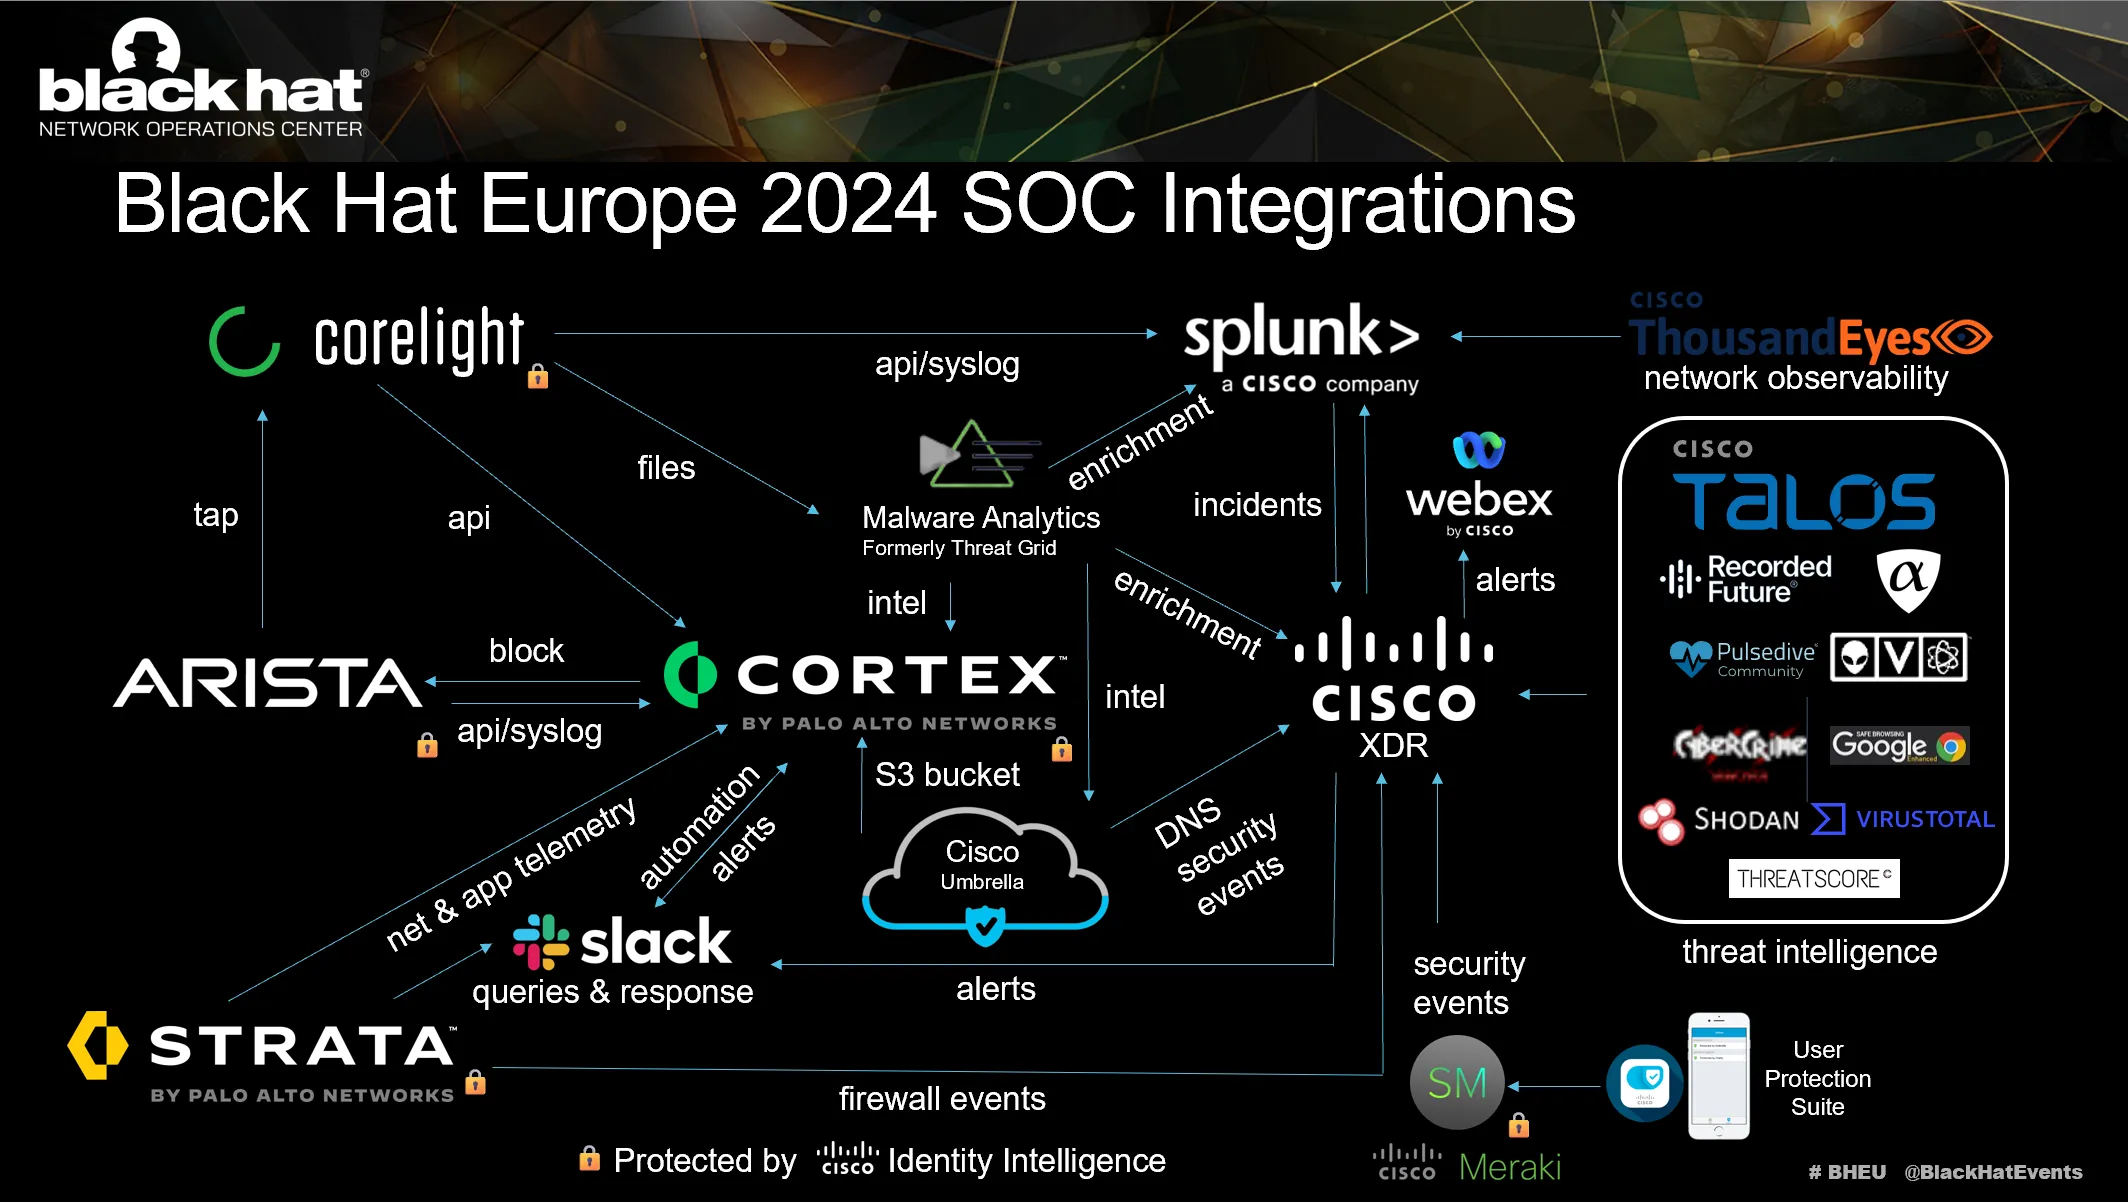
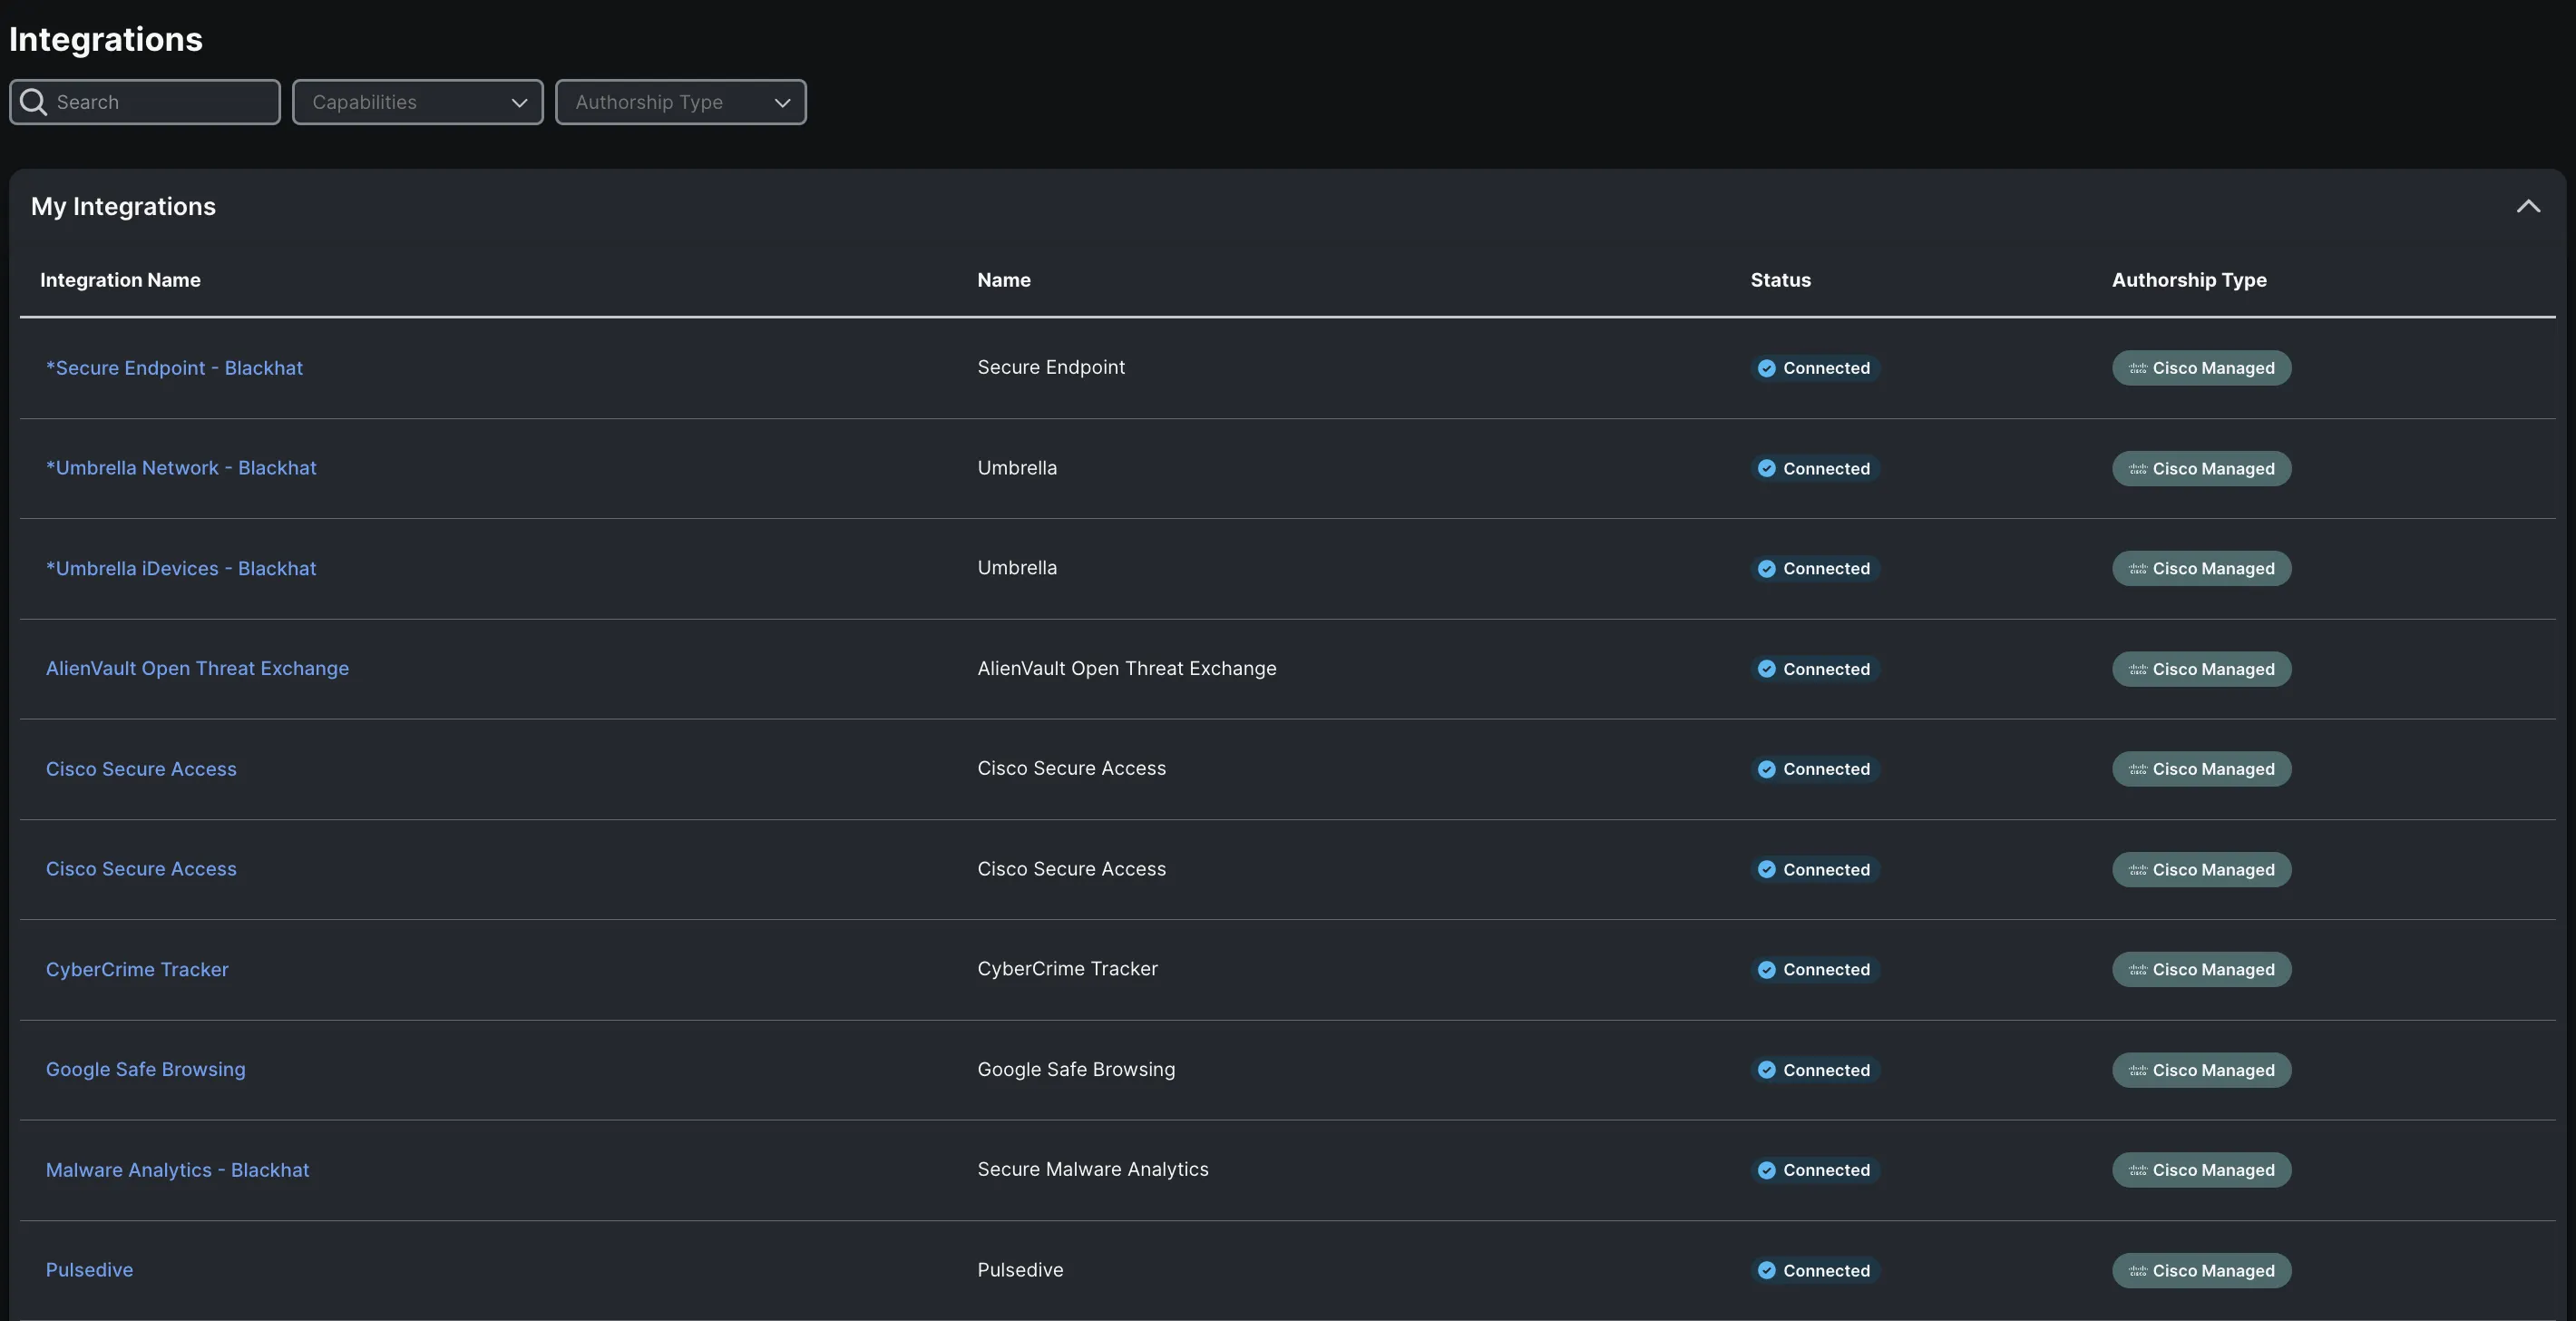
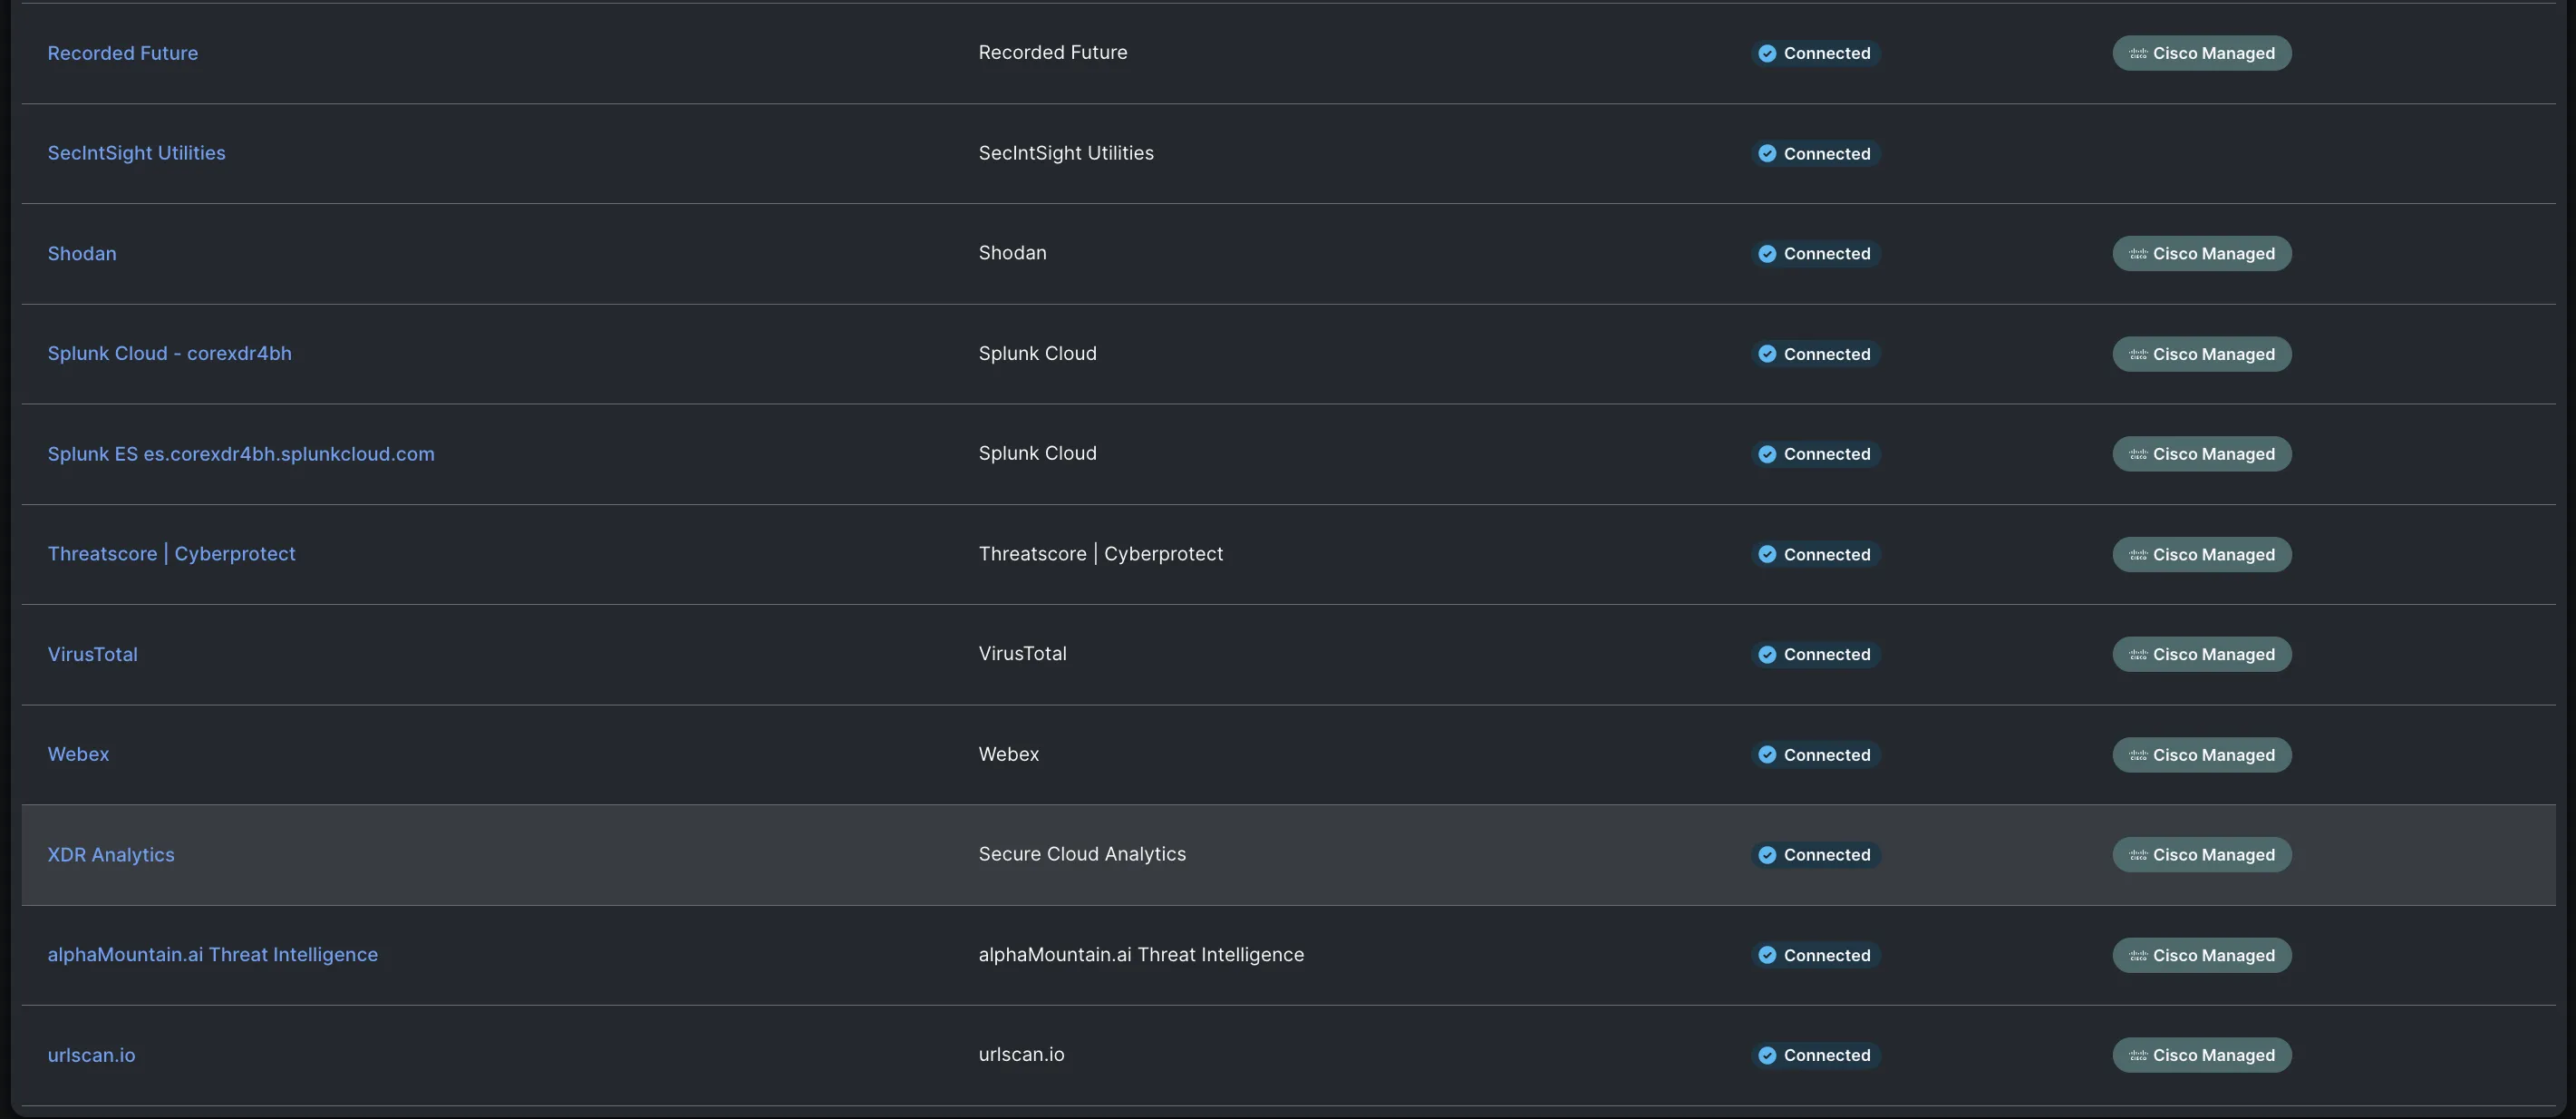
Below are the Cisco XDR integrations for Black Hat Europe, empowering our threat hunters to investigate Indicators of Compromise (IOC) very quickly, with one search.
We appreciate alphaMountain.ai, Pulsedive and Recorded Future donating full licenses to Cisco, for use in the Black Hat Europe 2024 NOC.
| Cisco Networking and Security | Third Party |
|---|---|
| Splunk Enterprise Security Cloud | Corelight Open NDR |
| Meraki System Manager | Palo Alto Networks |
| Secure Endpoint for iOS | alphaMountain.ai |
| Secure Malware Analytics | AlienVault OTX |
| ThousandEyes | CyberCrime Tracker |
| Secure Access/Umbrella DNS | Google Safe Browsing |
| Webex | Pulsedive |
| Recorded Future | |
| Shodan | |
| Threatscore | Cyberprotect| Cyberprotect | |
| VirusTotal | |
| Slack | |
| urlscan |
The view in the XDR Integrations user interface:
With the ever-evolving technological landscape, automation stands as a cornerstone in achieving XDR outcomes. It's indeed a testament to the prowess of Cisco XDR that it boasts a fully integrated, robust automation engine.
Cisco XDR Automation embodies a user-friendly, no-to-low code platform with a drag-and-drop workflow editor. This innovative feature empowers your SOC to speed up its investigative and response capabilities. You can tap into this potential by importing workflows within the XDR Automate Exchange from Cisco, or by flexing your creative muscles and crafting your own.
Remember from our past blogs, we used automation for incident notifications into Webex, as well as 'Creating an Incident
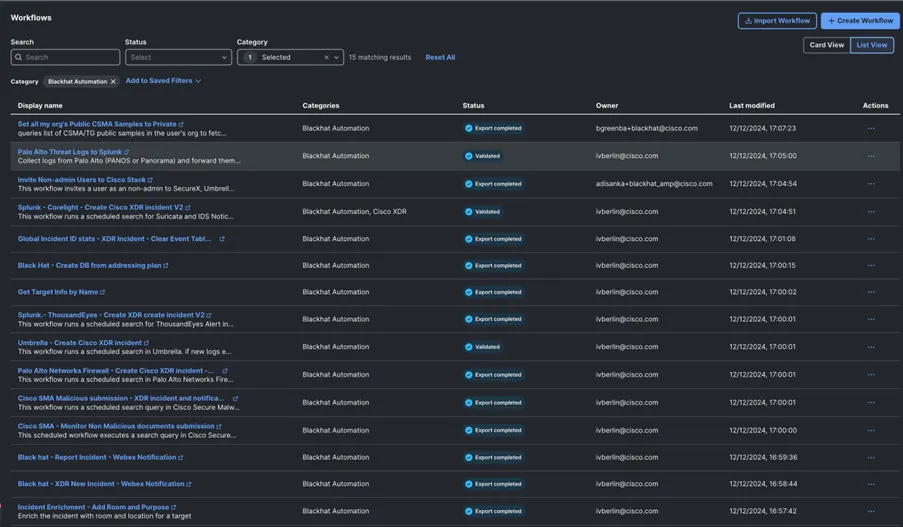
The following automation workflows were built specifically for Black Hat use cases:
Besides#1 and#3, the rest of these workflows were premiered at Black Hat Europe 2024, thanks to the work and inspiration of Ivan.
To make our threat hunters' lives richer with more context from ours and our partners' tools, we brought in Splunk Enterprise Security Cloud at this Black Hat event to ingest detections from Cisco XDR, Secure Malware Analytics, Umbrella, ThousandEyes, Corelight and Palo Alto Networks and visualize them into functional dashboards for executive reporting. The Splunk Cloud instance was configured with the following integrations:
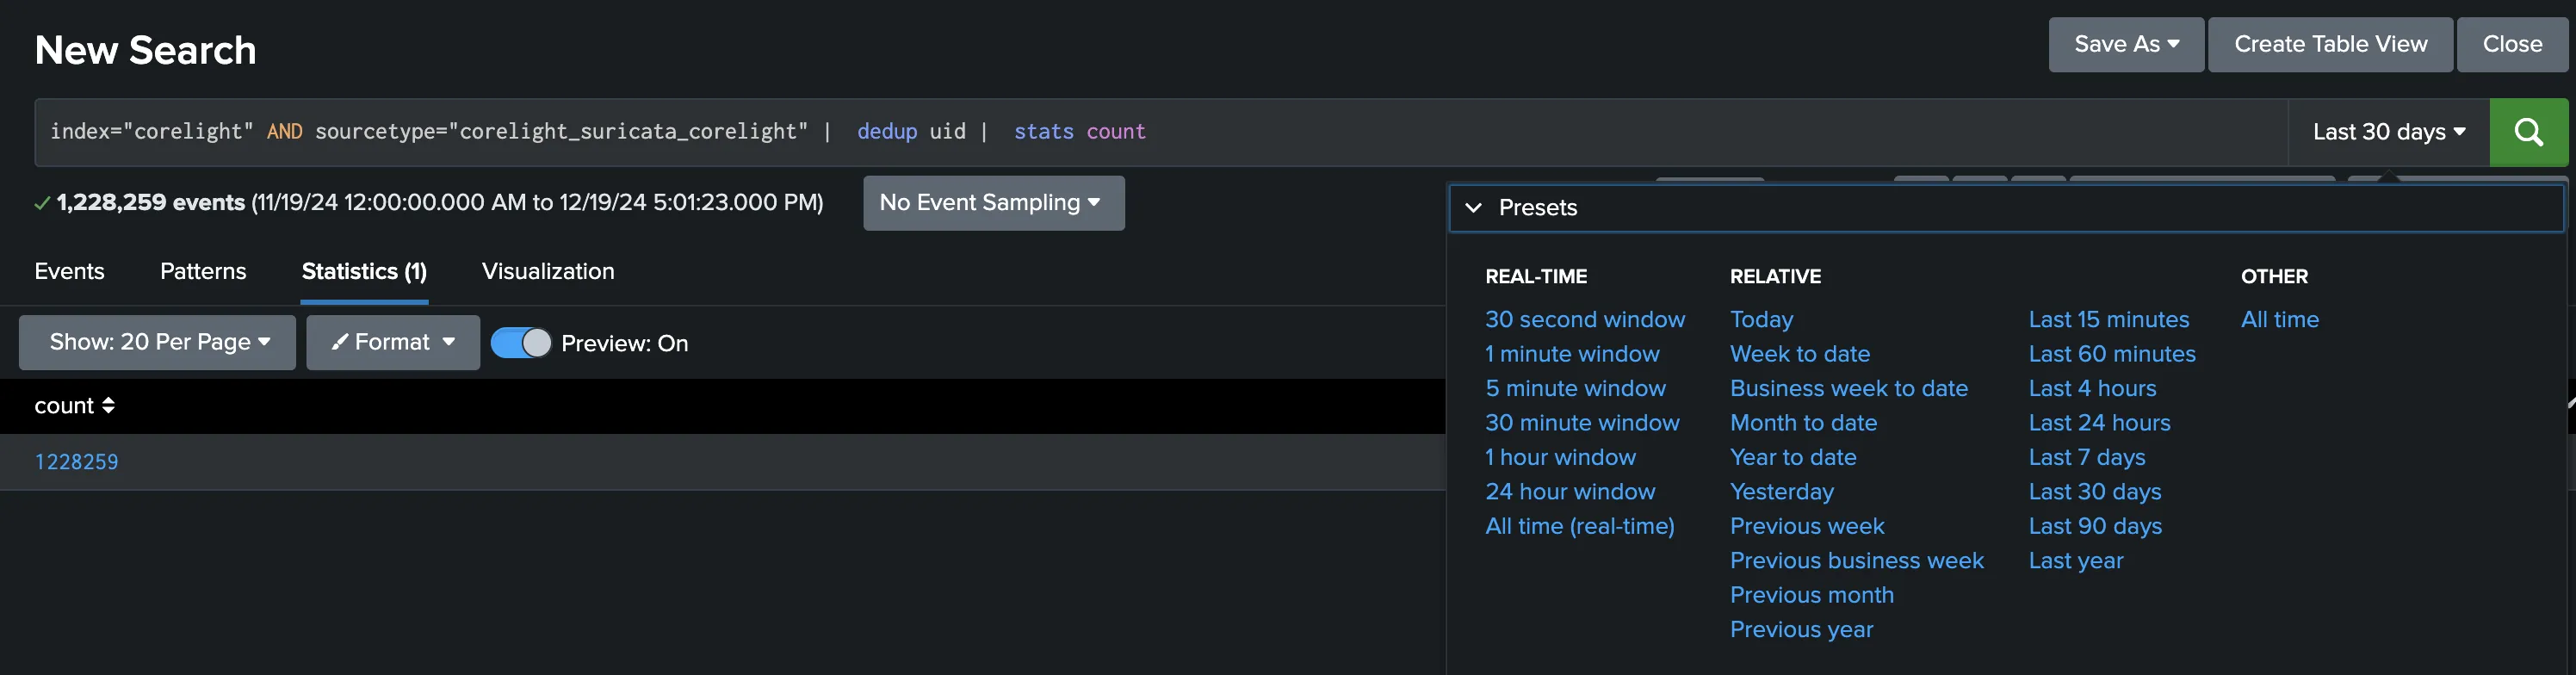
The ingested data for each integrated platform was deposited into their respective indexes. That made data searches for our threat hunters cleaner. Searching for data is where Splunk shines! You begin by simply navigating toApps > Search and Reporting
We found our way through looking at the data and iterating. An example of a simple search for obtaining the count of all alerts from the Suricata engine of Corelight logs is below.
The Visualization
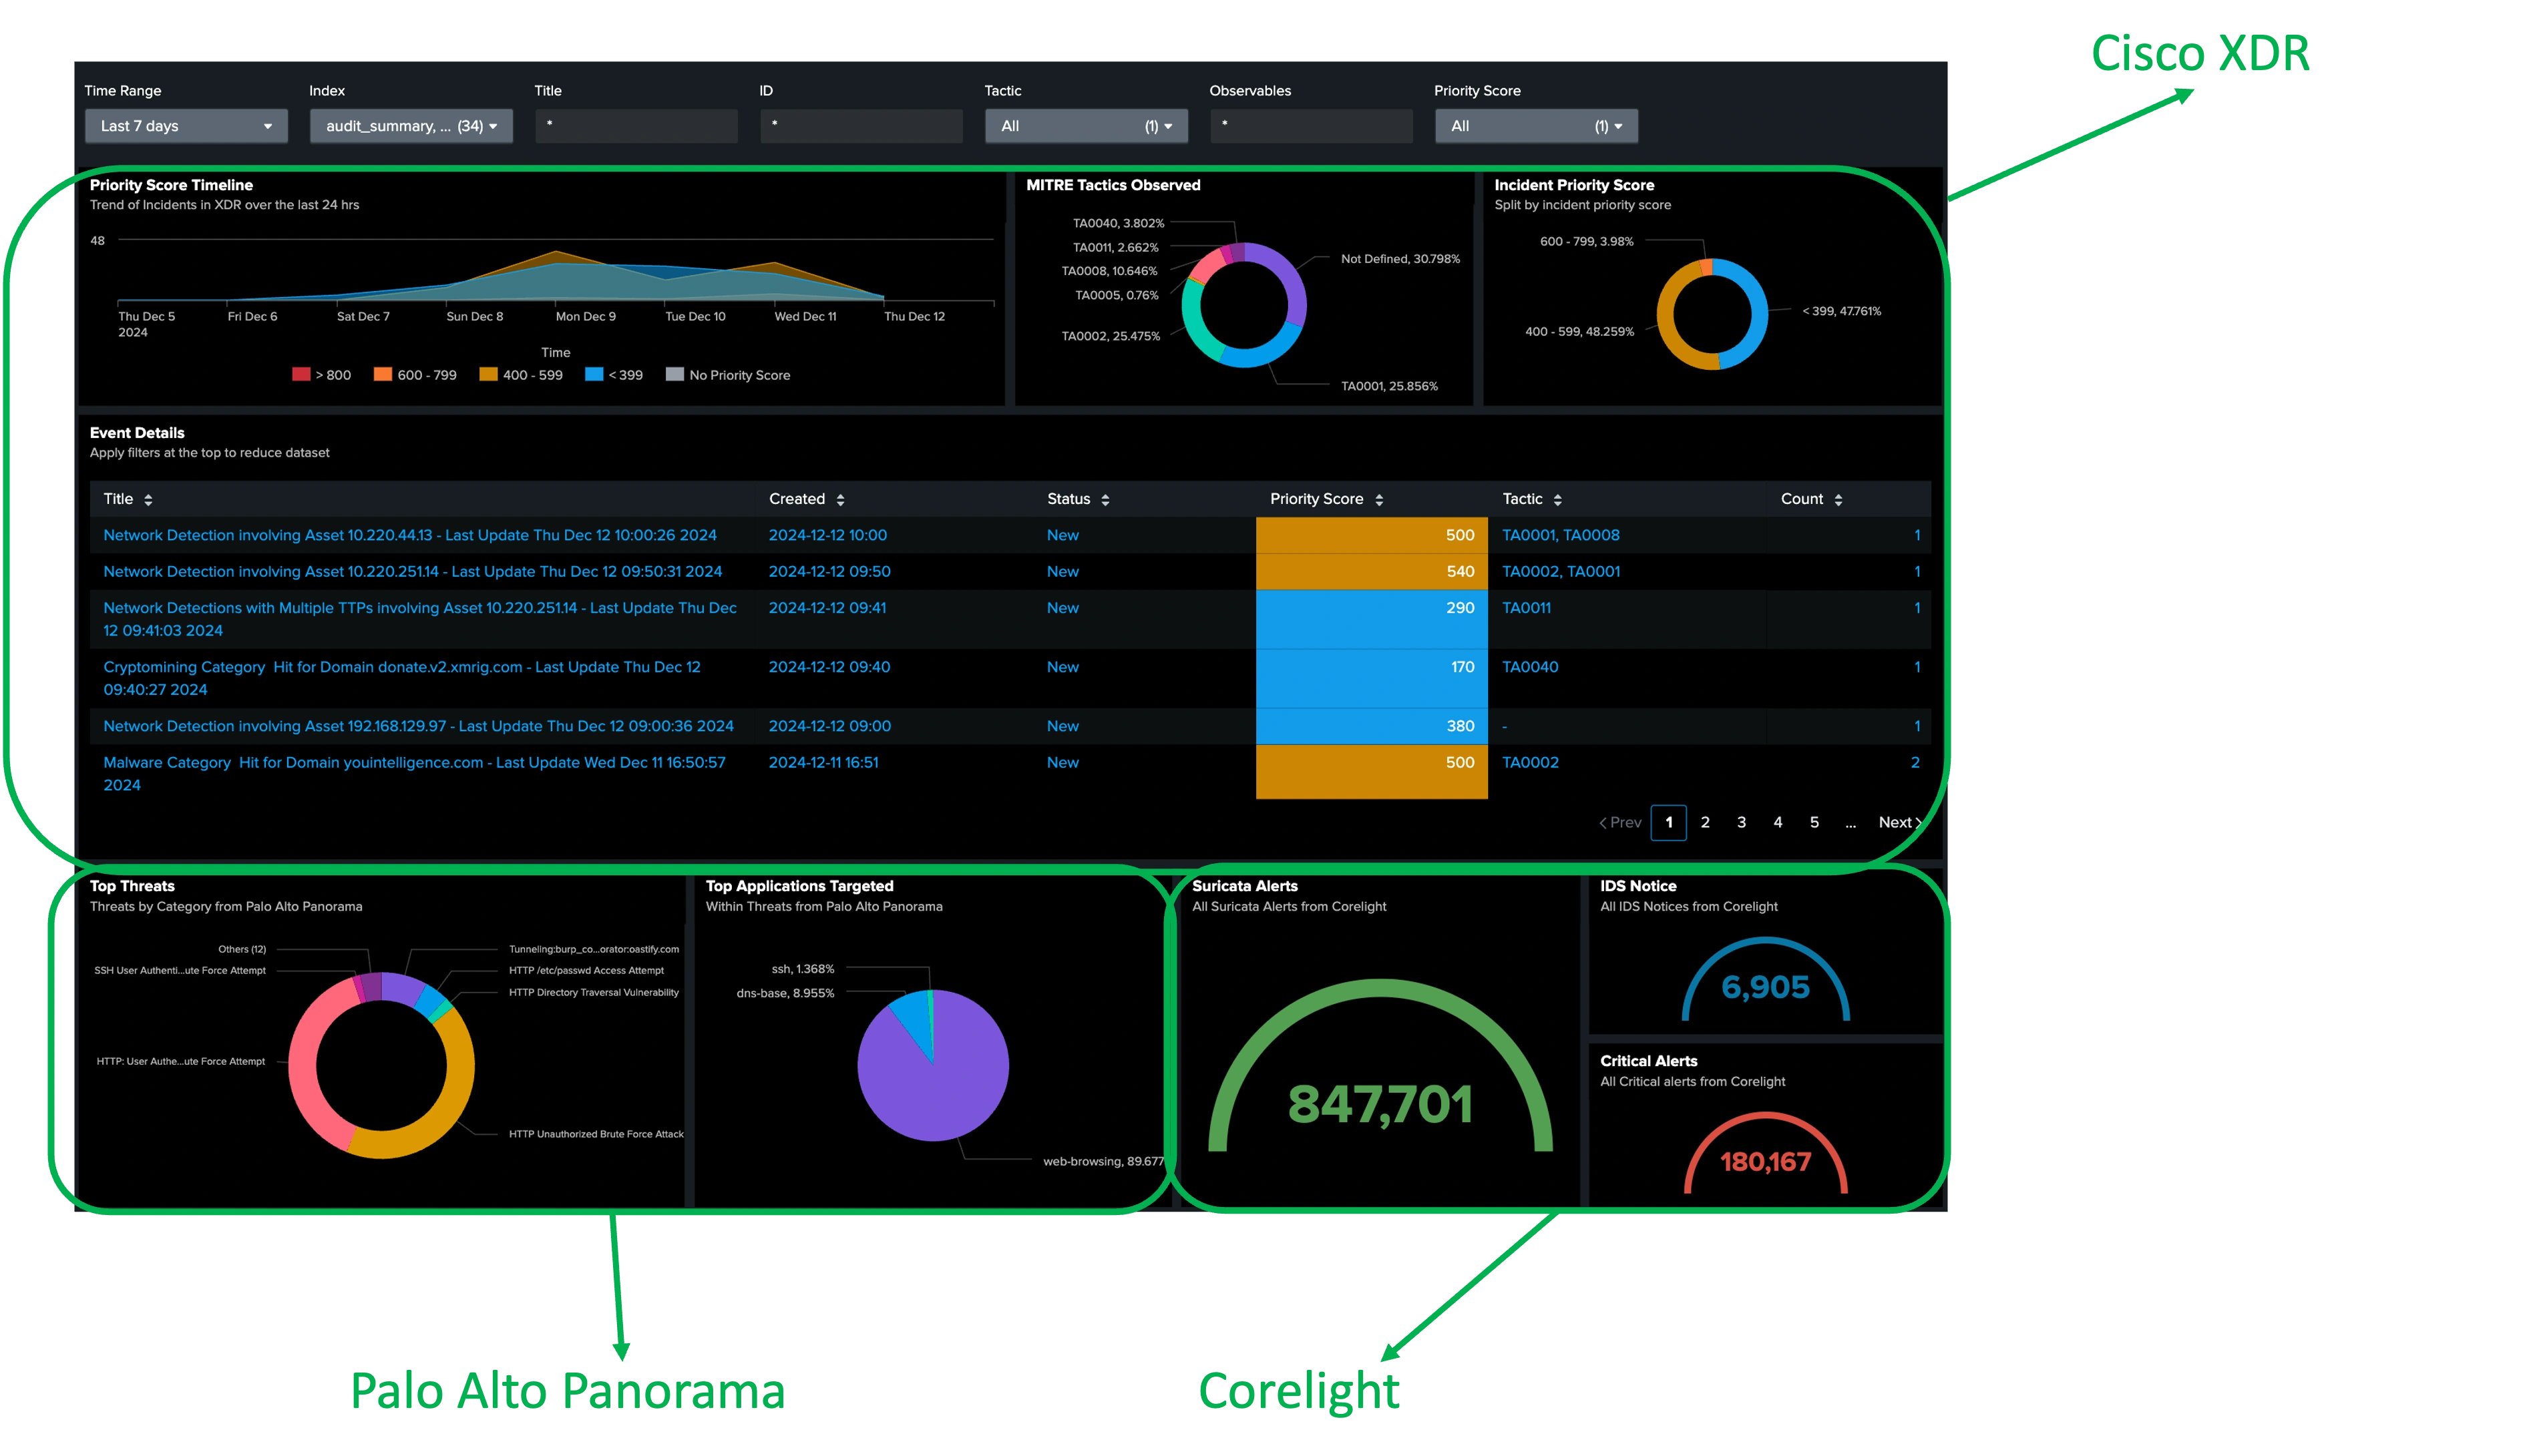
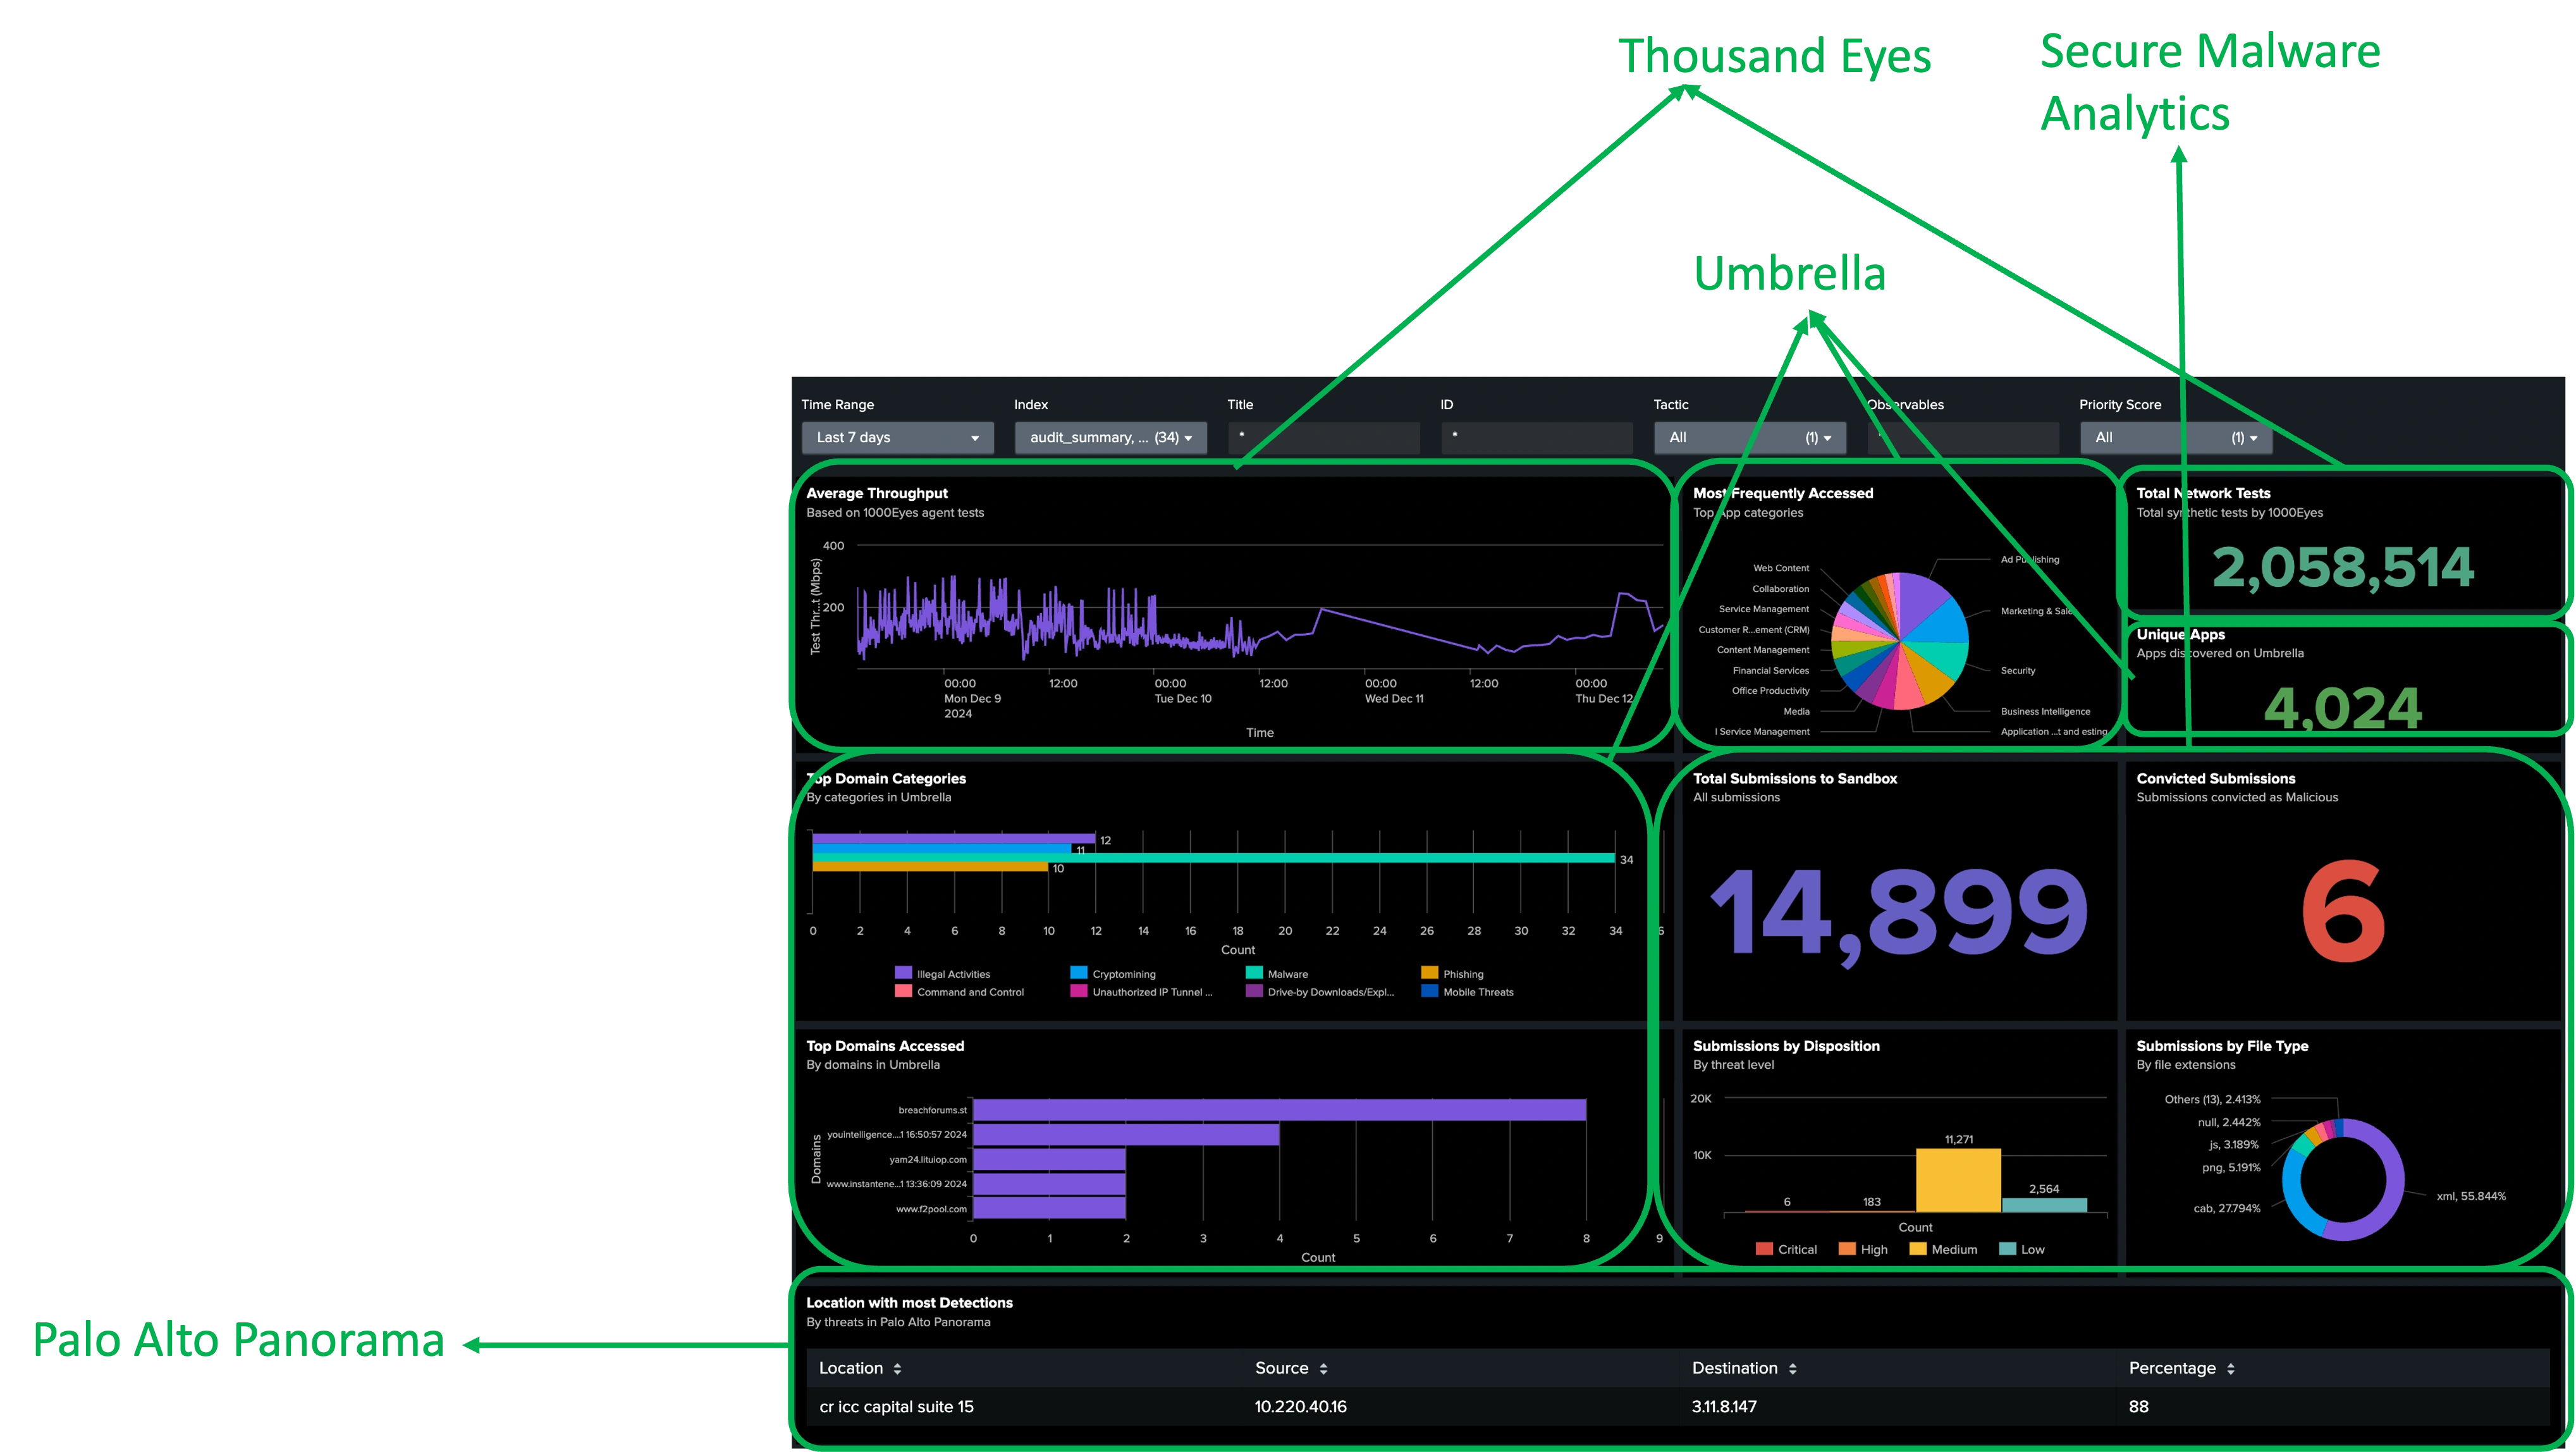
With the charter for us at Black Hat being a 'SOC within a NOC', the executive dashboards were reflective of bringing networking and security reporting together. This is quite powerful and will be expanded in future Black Hat events, to add more functionality and expand its usage as one of the primary consoles for our threat hunters as well as reporting dashboards on the large screens in the NOC.
During the Black Hat event, the NOC opens early before the event Registration and closes after the trainings and briefings complete for the day. This means that every threat hunter's position must be covered by physical, uninterrupted presence for about 11 hours per day. Even with the utmost dedication to your role, sometimes you need a break, and a new potential incident doesn't wait until you've finished the previous one.
Aditya and I shared the responsibilities as Threat Hunters staffing the Cisco XDR, Malware Analytics and Splunk Cloud consoles, alternating between morning and afternoon shifts. Though in reality both of us stayed on most of the day as we had so much fun writing automation workflows and building dashboards, besides carrying out our primary responsibilities.
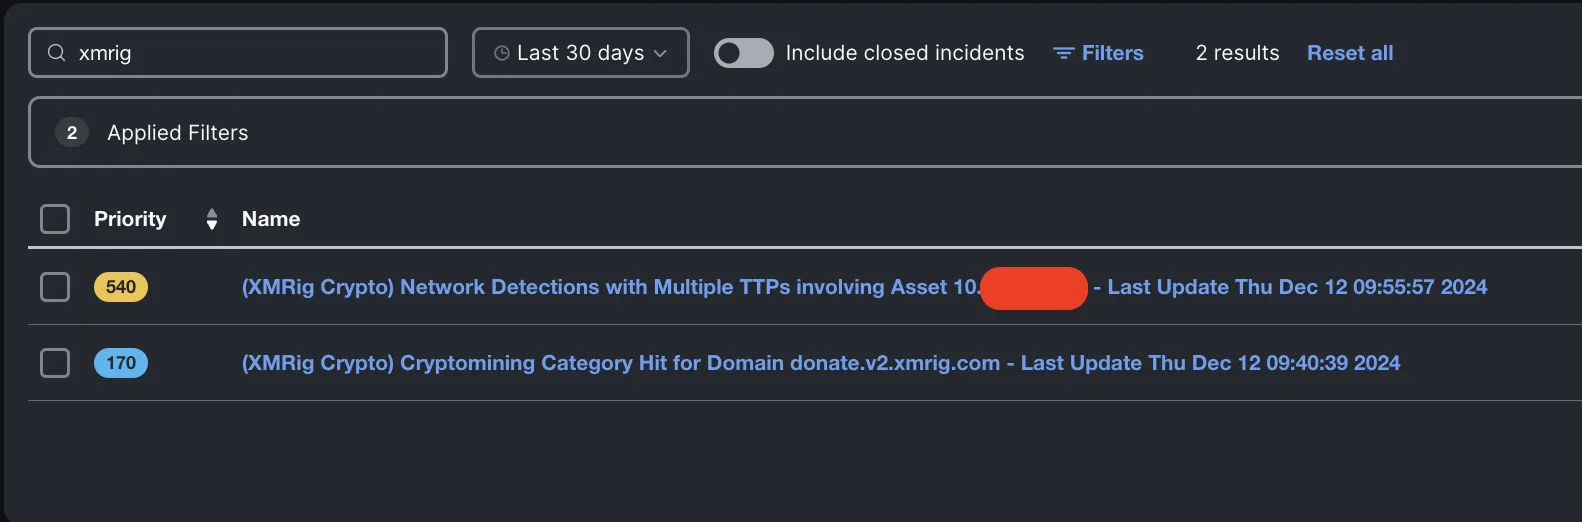
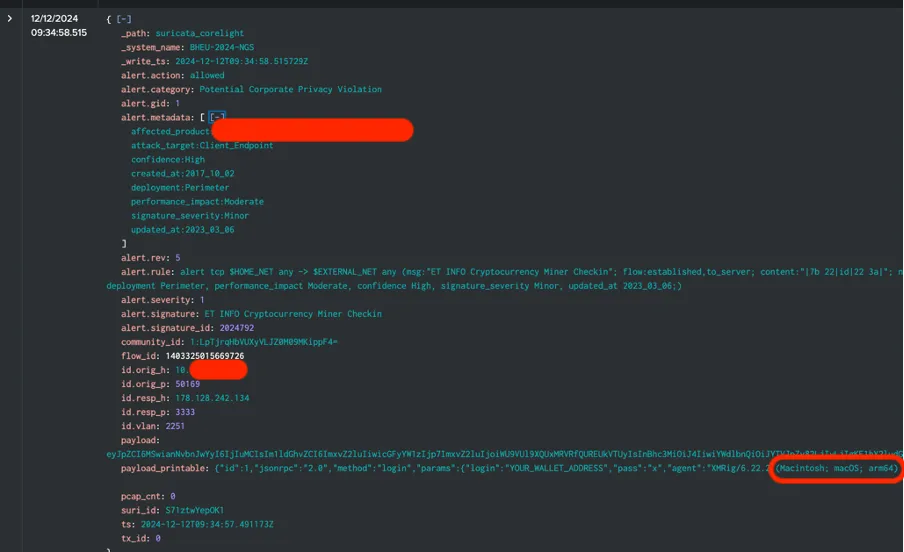
An example of some of these workflows in action together helped us hunt down a potential case of cryptomining in the NOC itself, during the early hours of Dec 12! Thanks to the Corelight and PANW firewalls integrations in XDR, we had ourselves a singular correlated incident, with detections from both partners.

The workflows I built include a check to find any open incidents with the assets and/or observables in question, to append the detection under process. If there is none, it would create a new incident. As we can see, the detection from Corelight came in at 09:40 GMT, followed by the detection from PANW firewalls a few minutes later.

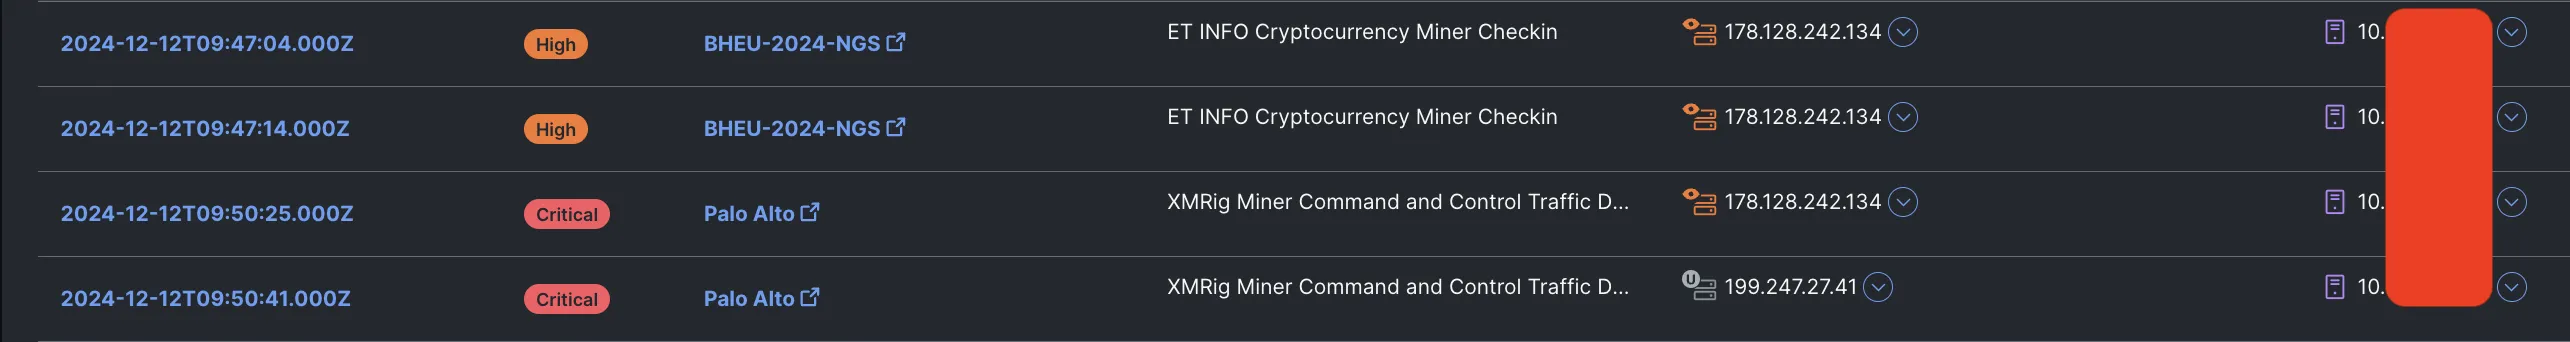
As new detections were getting appended into the incident, I quickly updated the automation workflows to include a timestamp indicating the last seen sighting for that incident right in the title. While this might not be what you would do in a production environment, it greatly simplifies the ability for our threat hunters to analyze all the incidents as they come in.
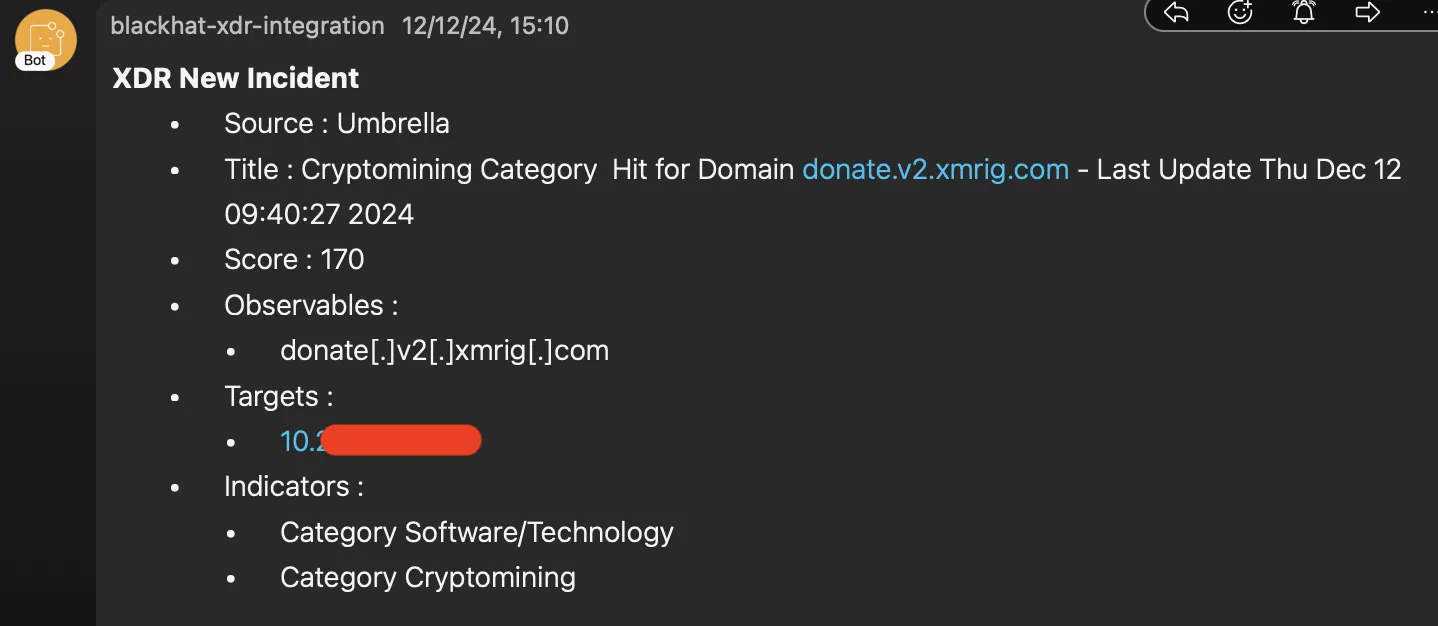
As I investigated the incident, I uncovered another detection that had come in just before, this time the source of the detection was Umbrella and almost went under the radar due to it bearing a lower priority score. This incident came in through the automation workflow used in the past years. This provided the confirmation of the cryptomining activity on the endpoint.
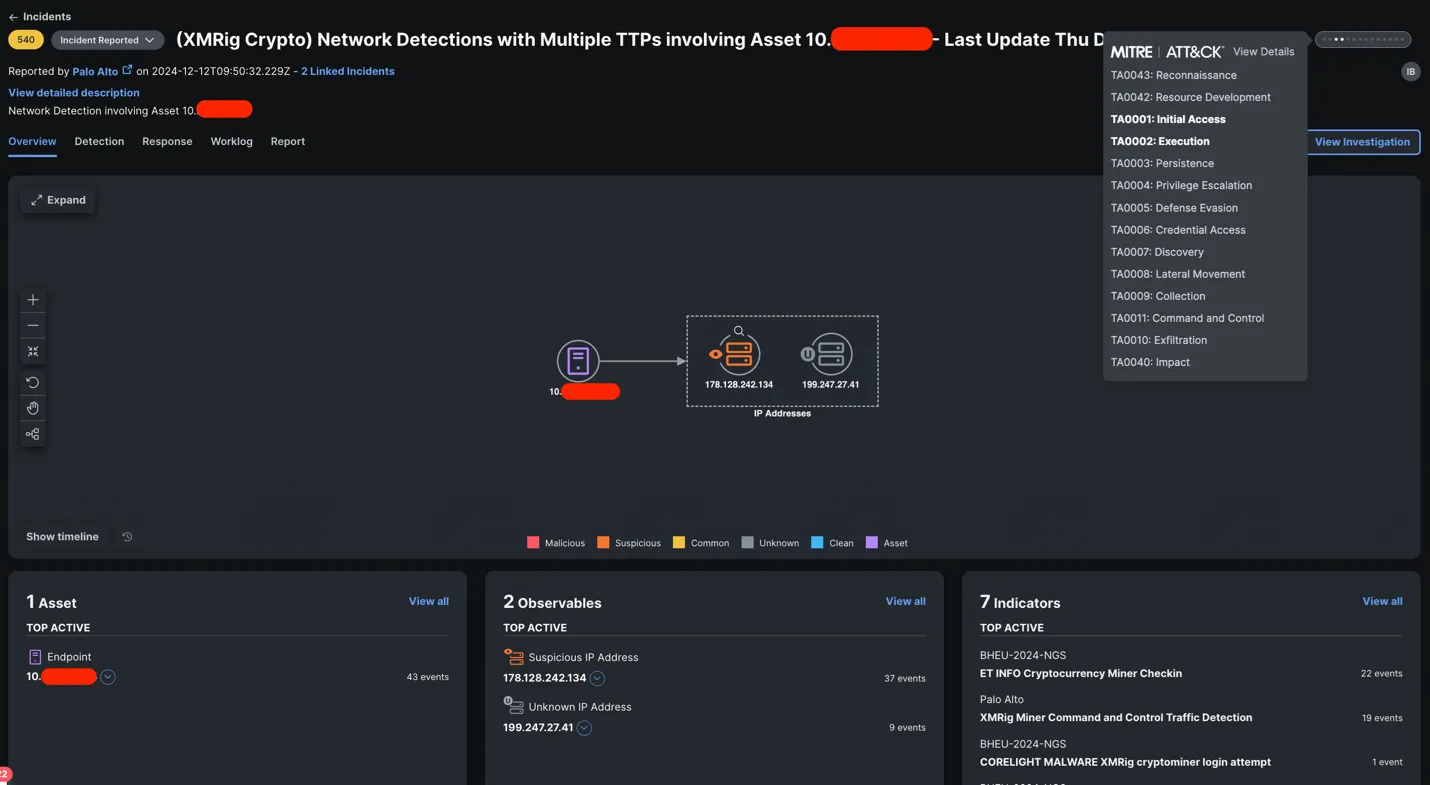
Next question -who is this 10.X.X.X device? And should they be cryptomining at Black Hat? Thanks to another automation workflow, with a click of aResponse
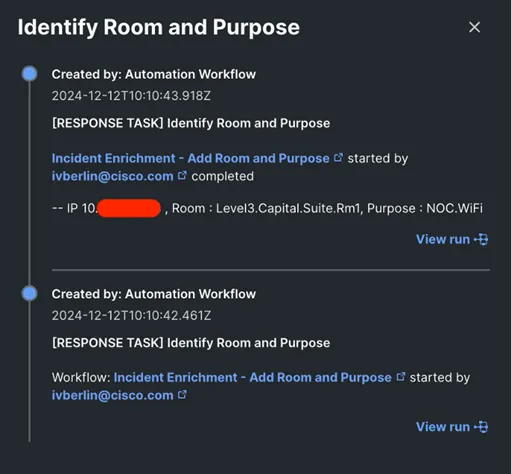
Lo and behold -the asset was in Level 3, Capital Suite, Room 1 connected to the NOC Wi-Fi; right in the same room as me! I had built another automation workflow that brings in Corelight and PANW firewall threat detections into Splunk Cloud, through which we were able to track down the device in the room to a MacBook and an MAC address.
Time to tap on someone's shoulder.
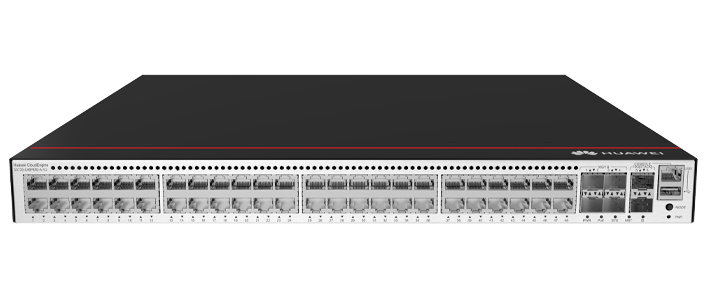
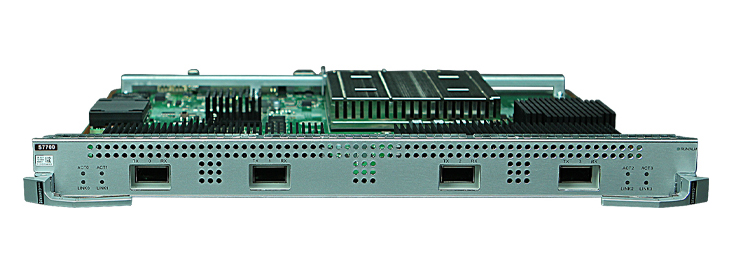
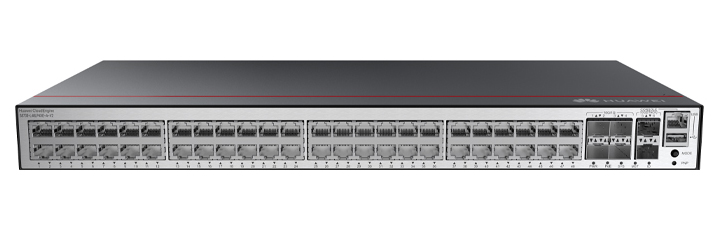
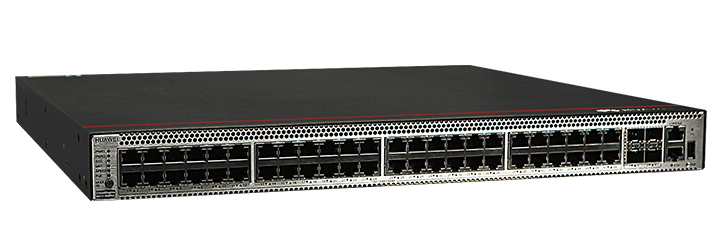
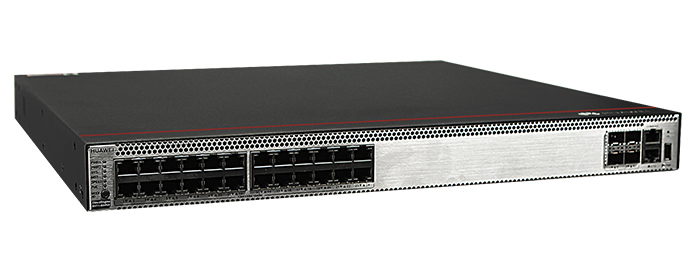
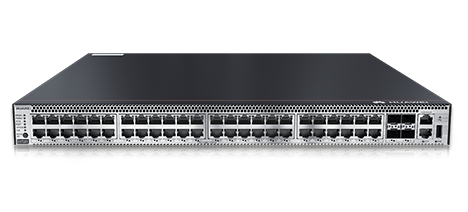
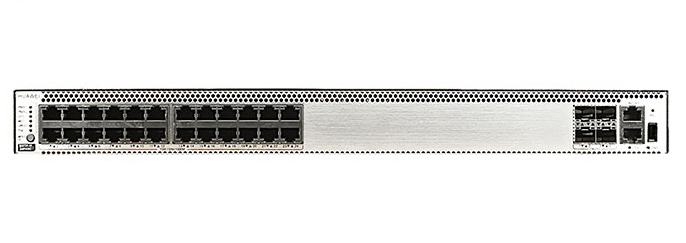
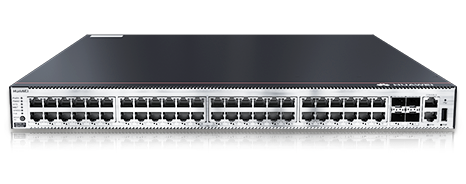
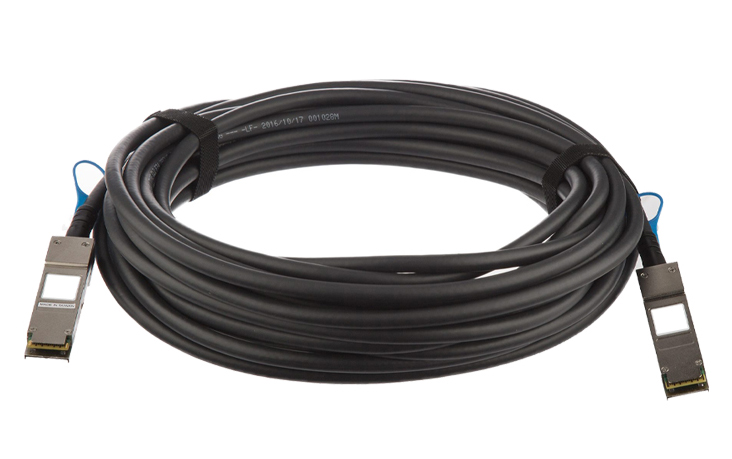
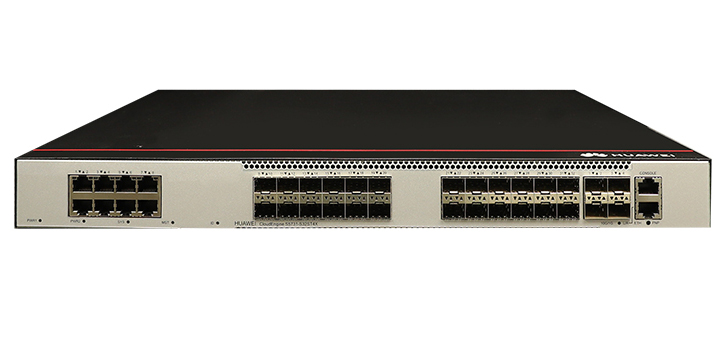
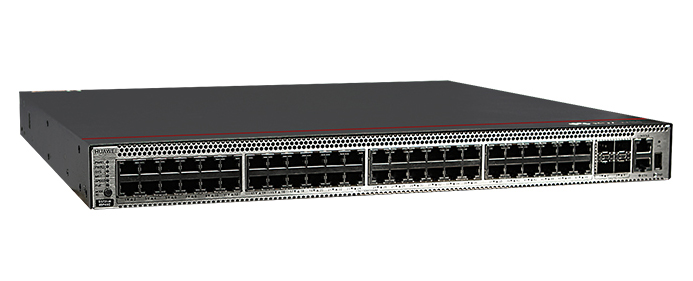
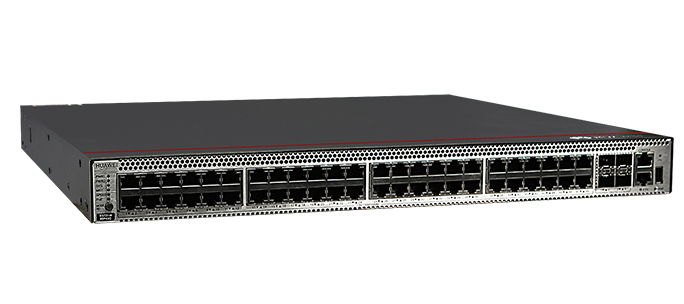
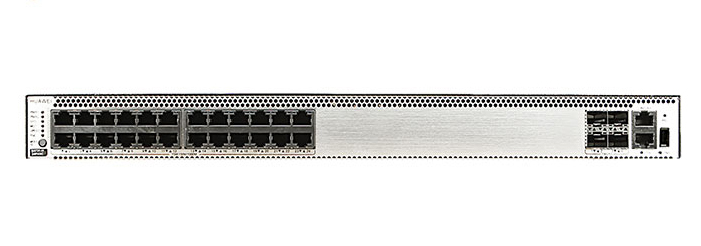
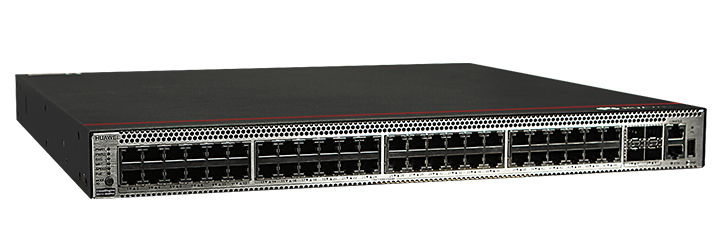
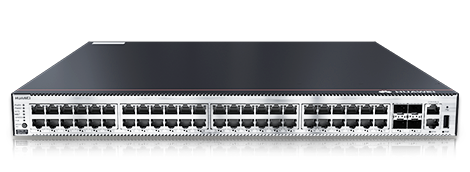
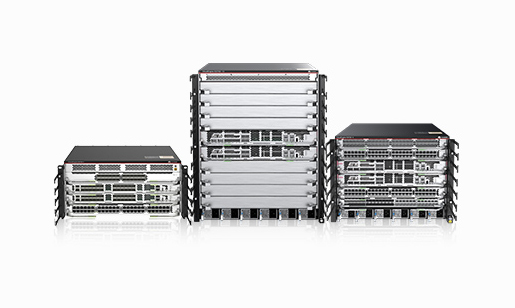
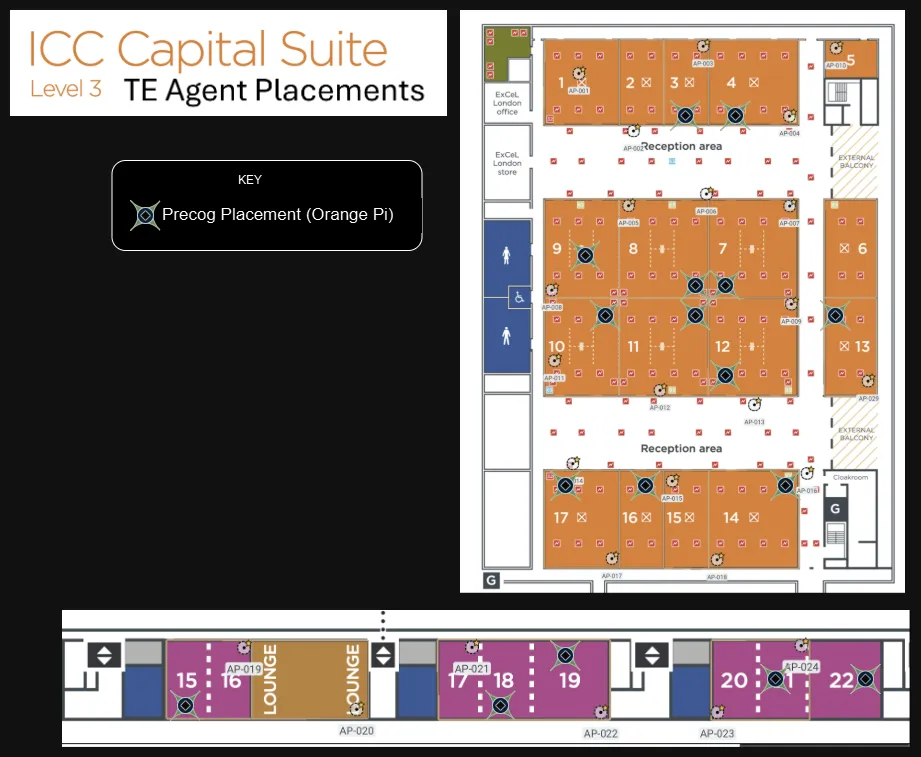
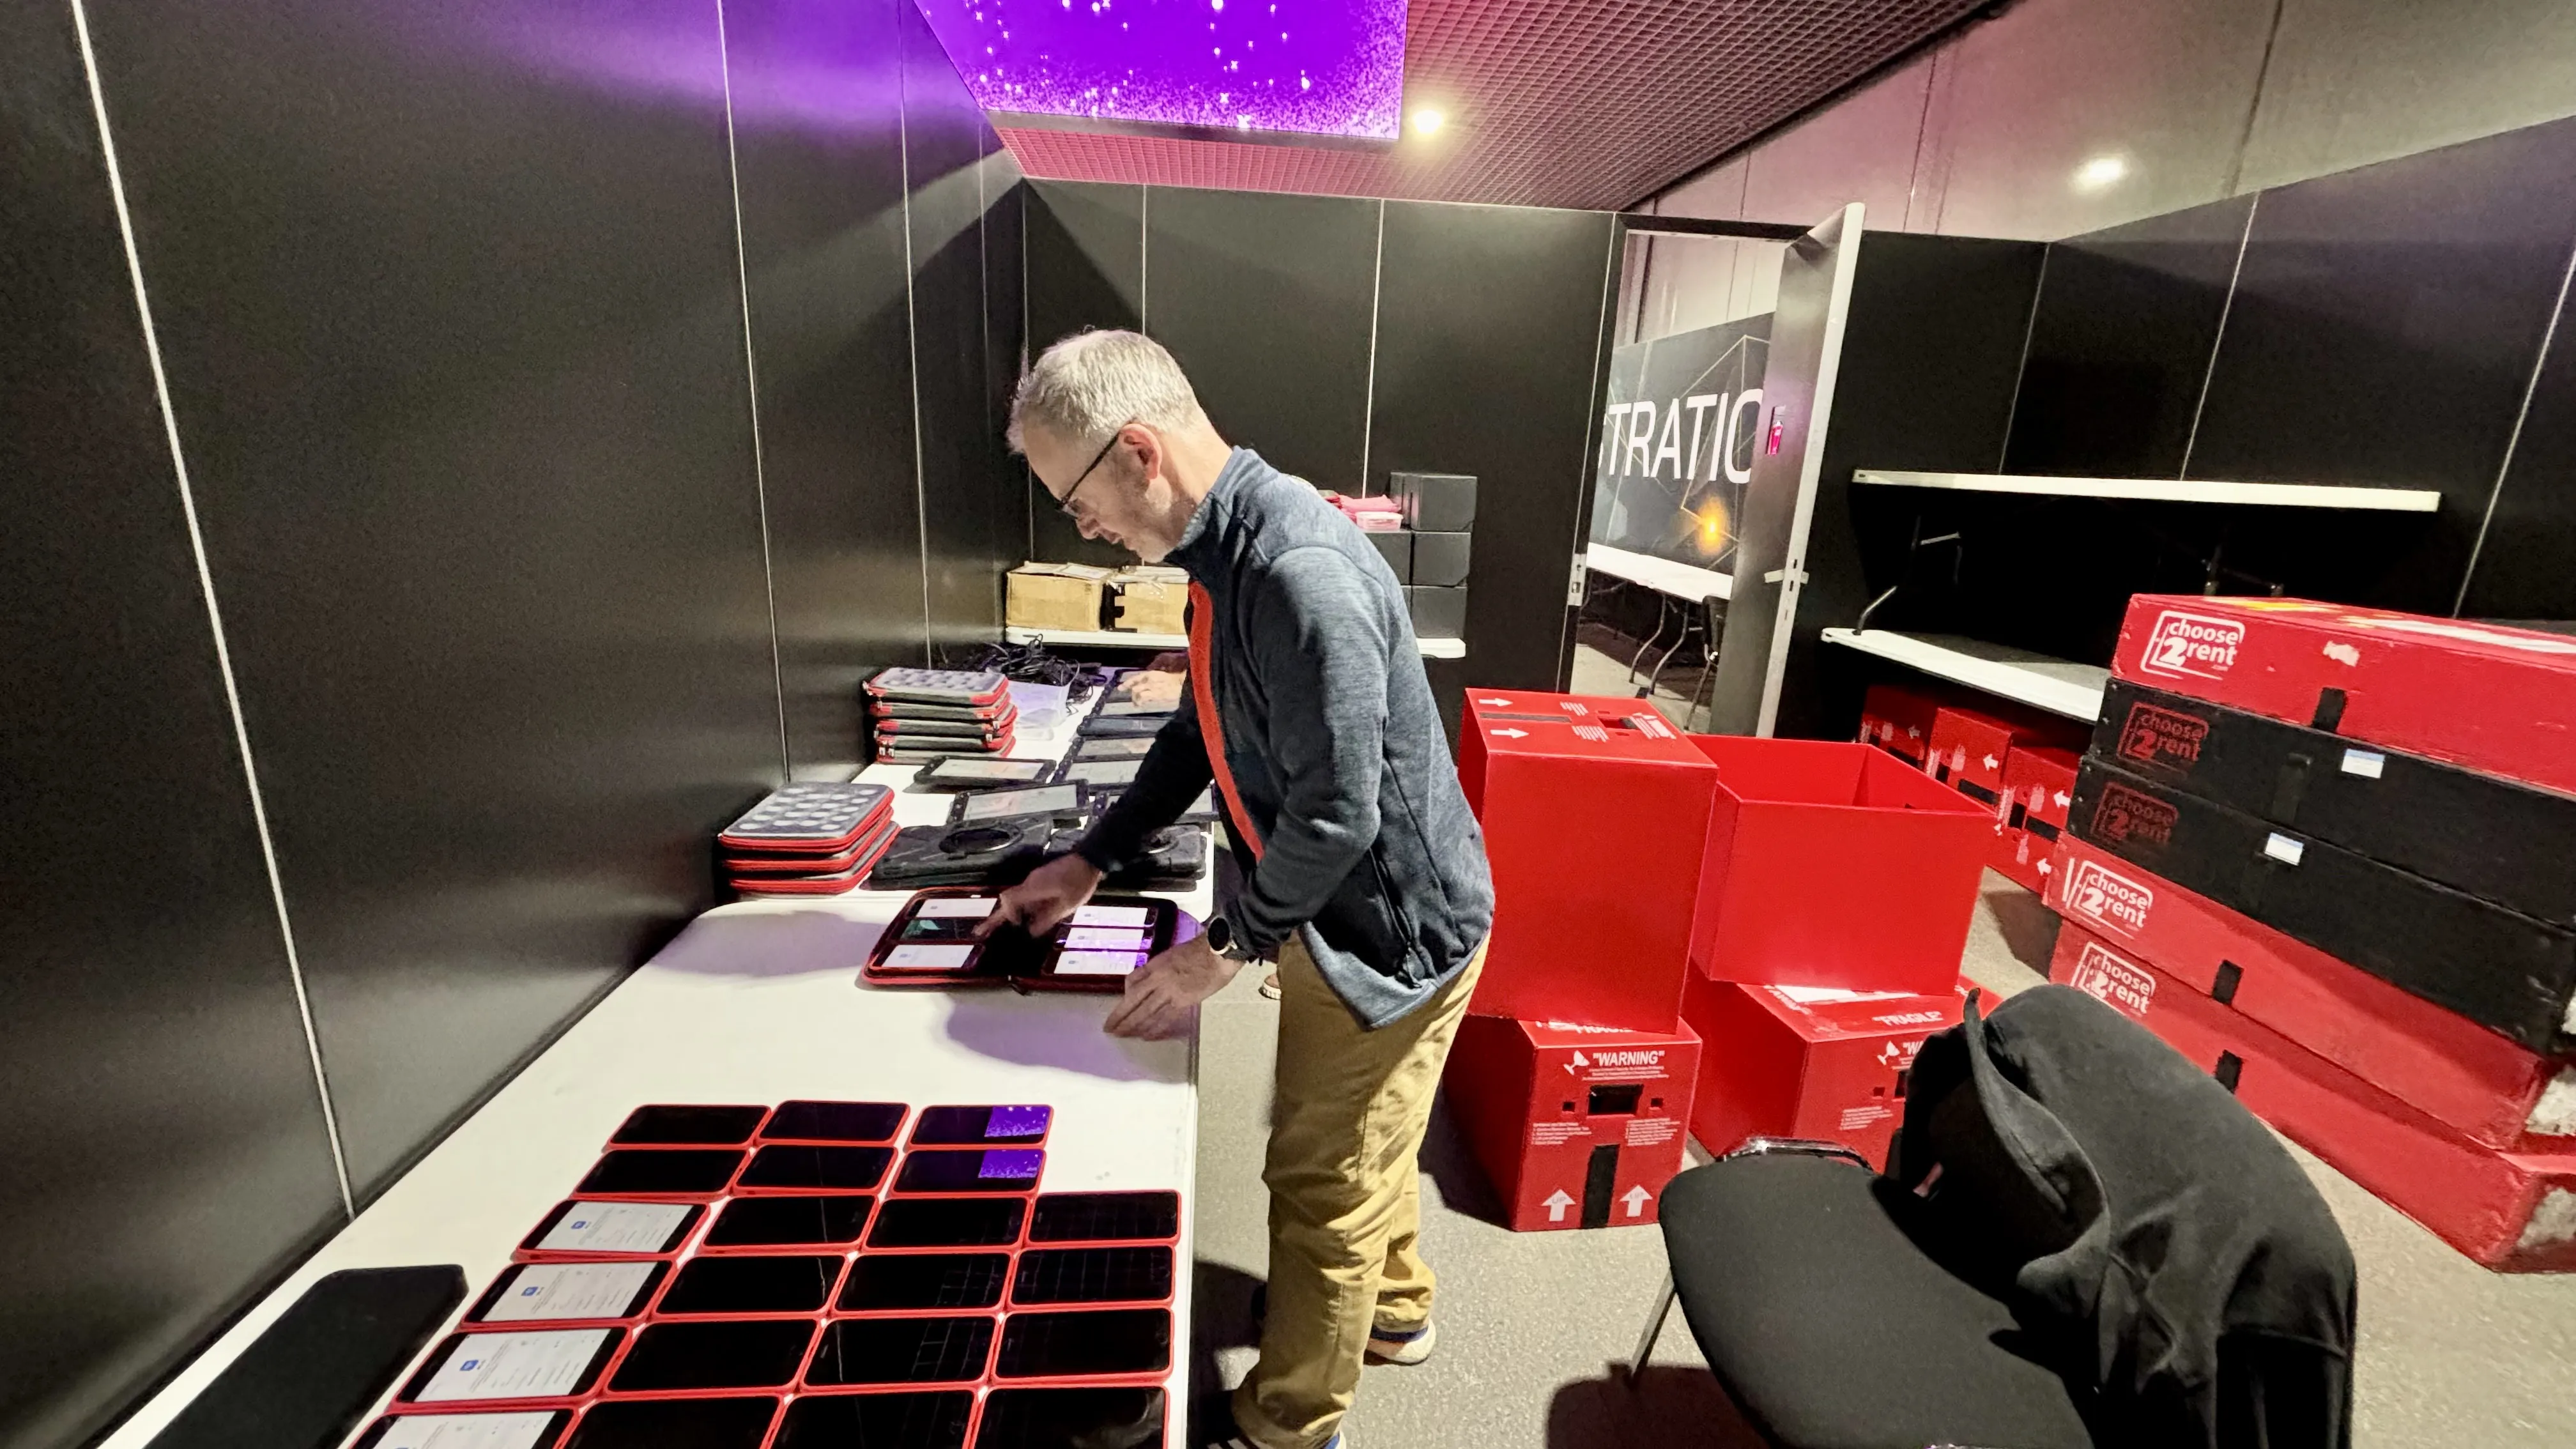
Black Hat Europe 2024 is the sixth consecutive event with a ThousandEyes (TE) deployment. We spread that visibility across core switching, Registration, the Business Hall, two- and four-day training rooms, and Keynote areas. Below is Some of the hardware Black Hat purchased for the ThousandEyes agents.
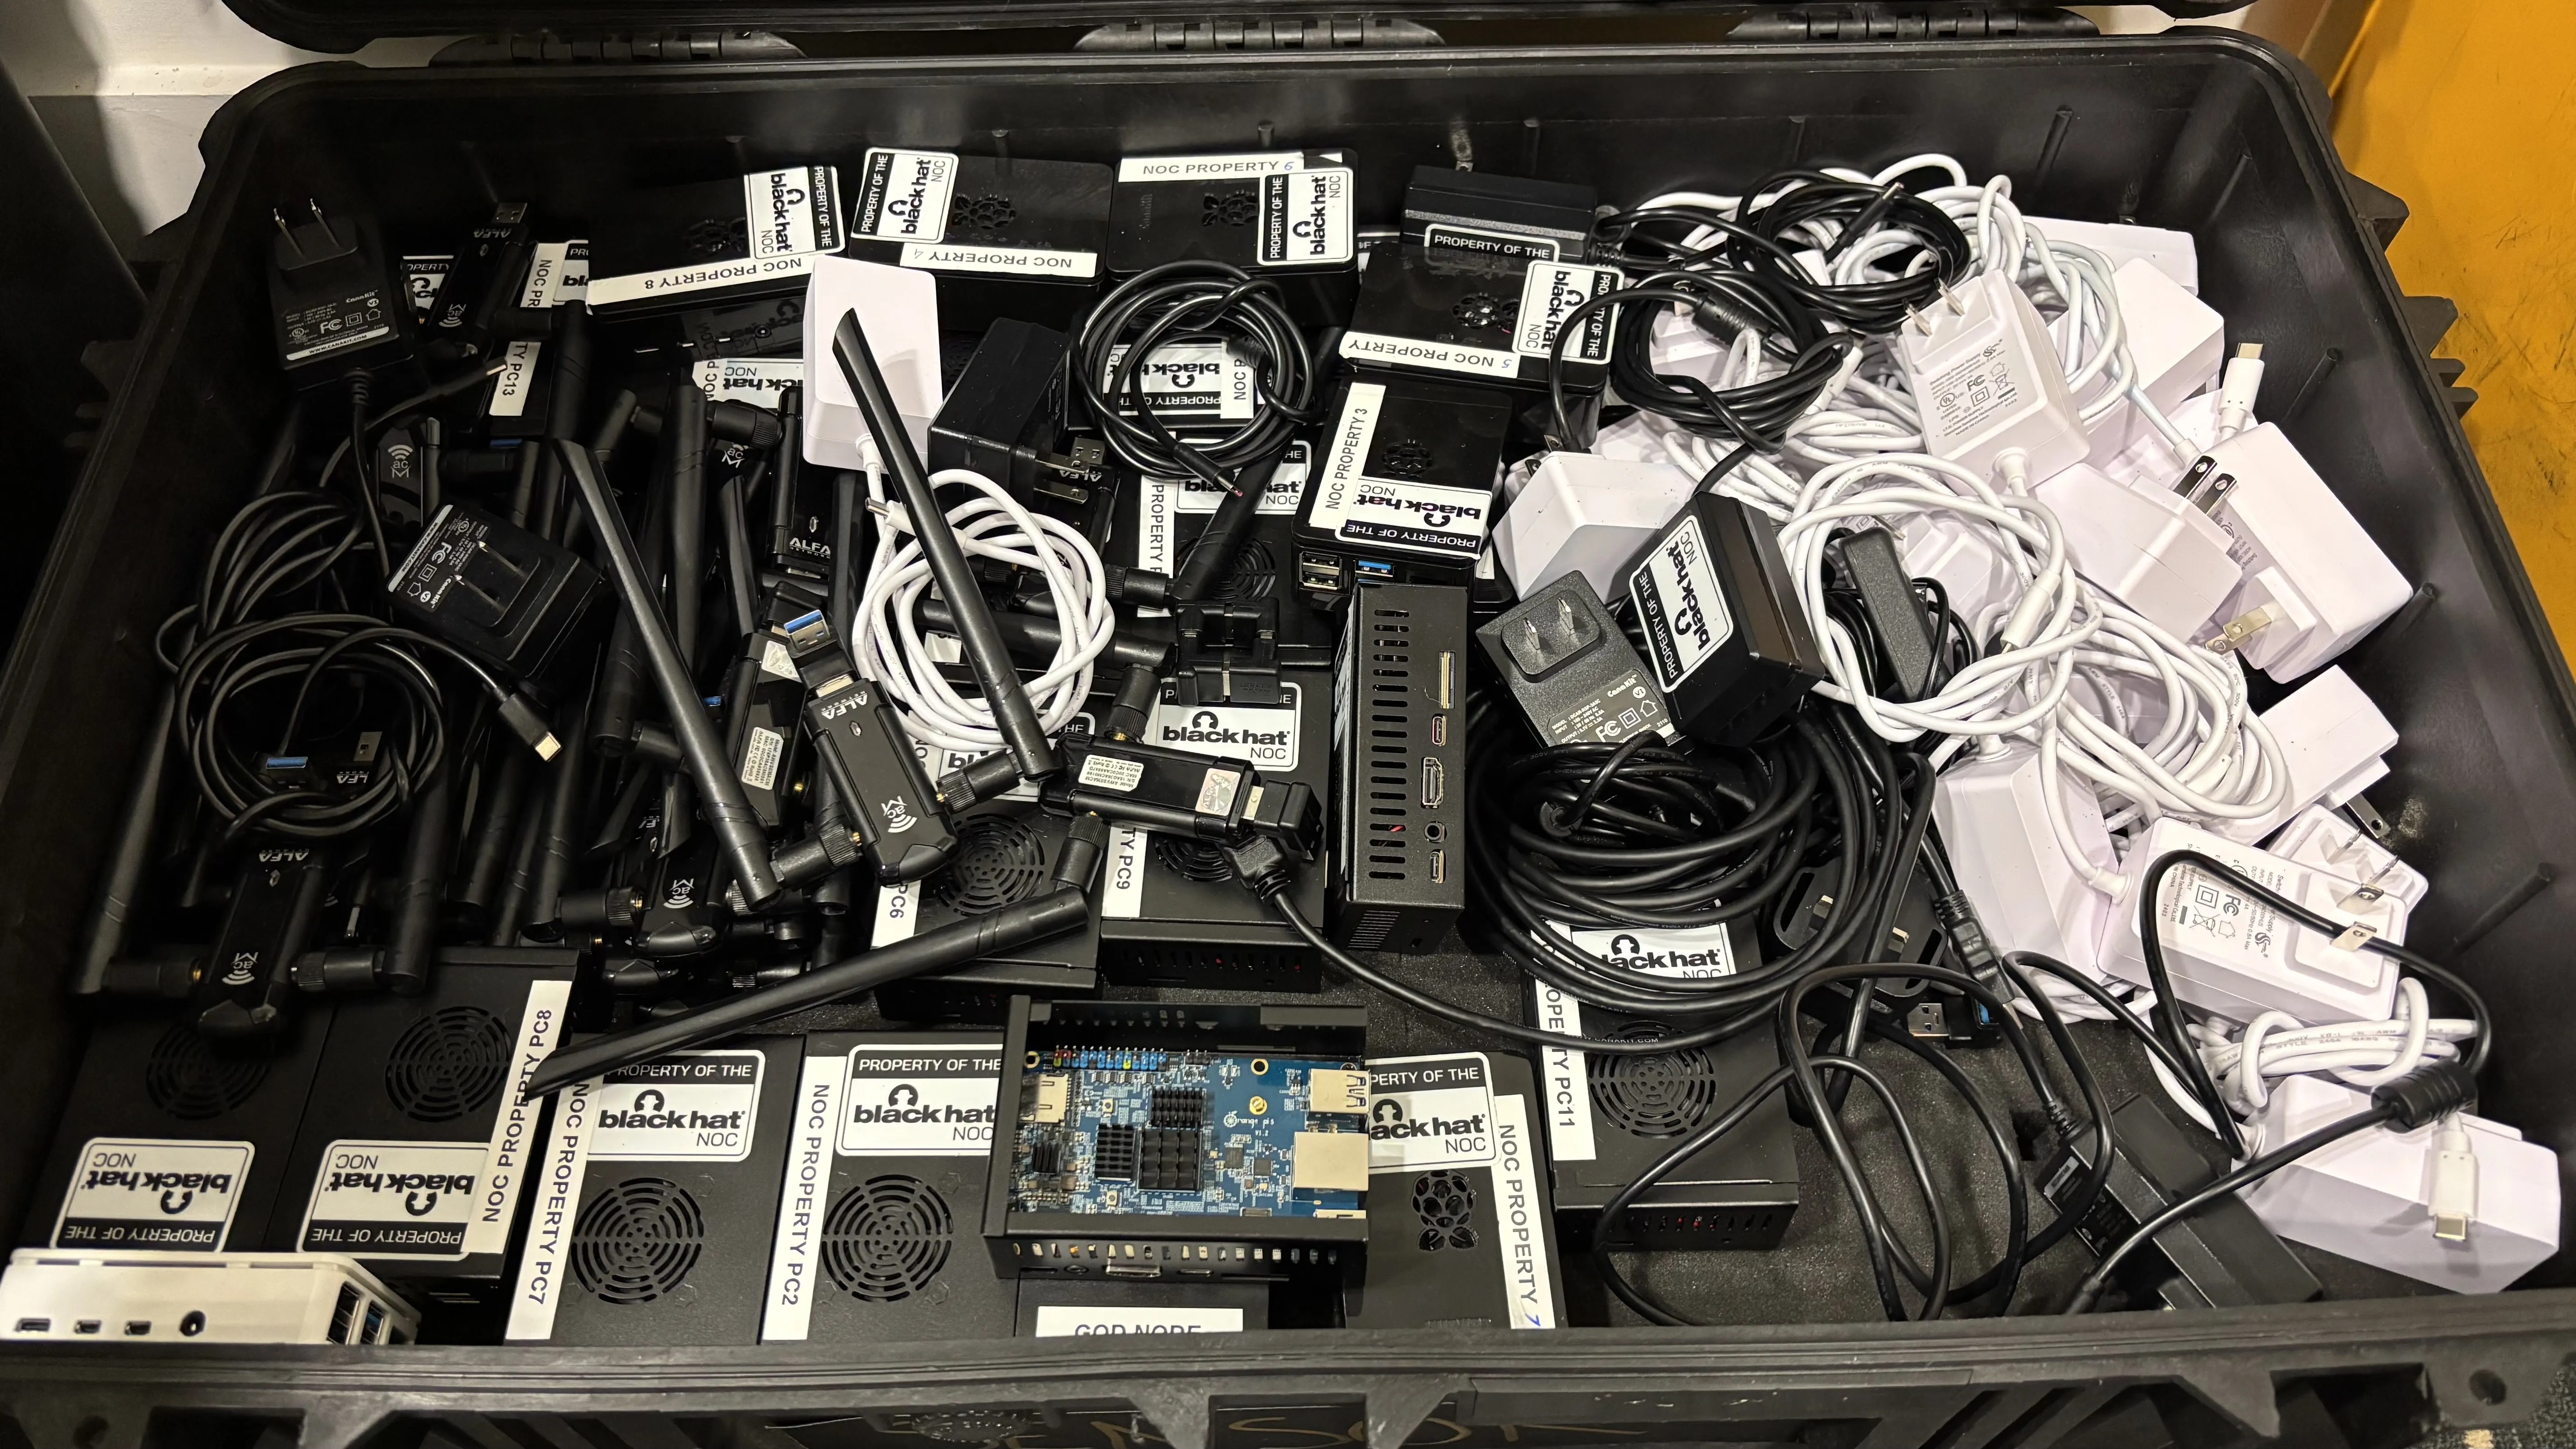
We worked with Michael Spicer on the location of the agent deployment to ensure representative coverage and the types / frequency of scheduled testing.
We had a dashboard in the NOC, so the leaders and architect could see issues in real time, and ThousandEyes widgets in the Splunk executive dashboard, as seen earlier in the blog.
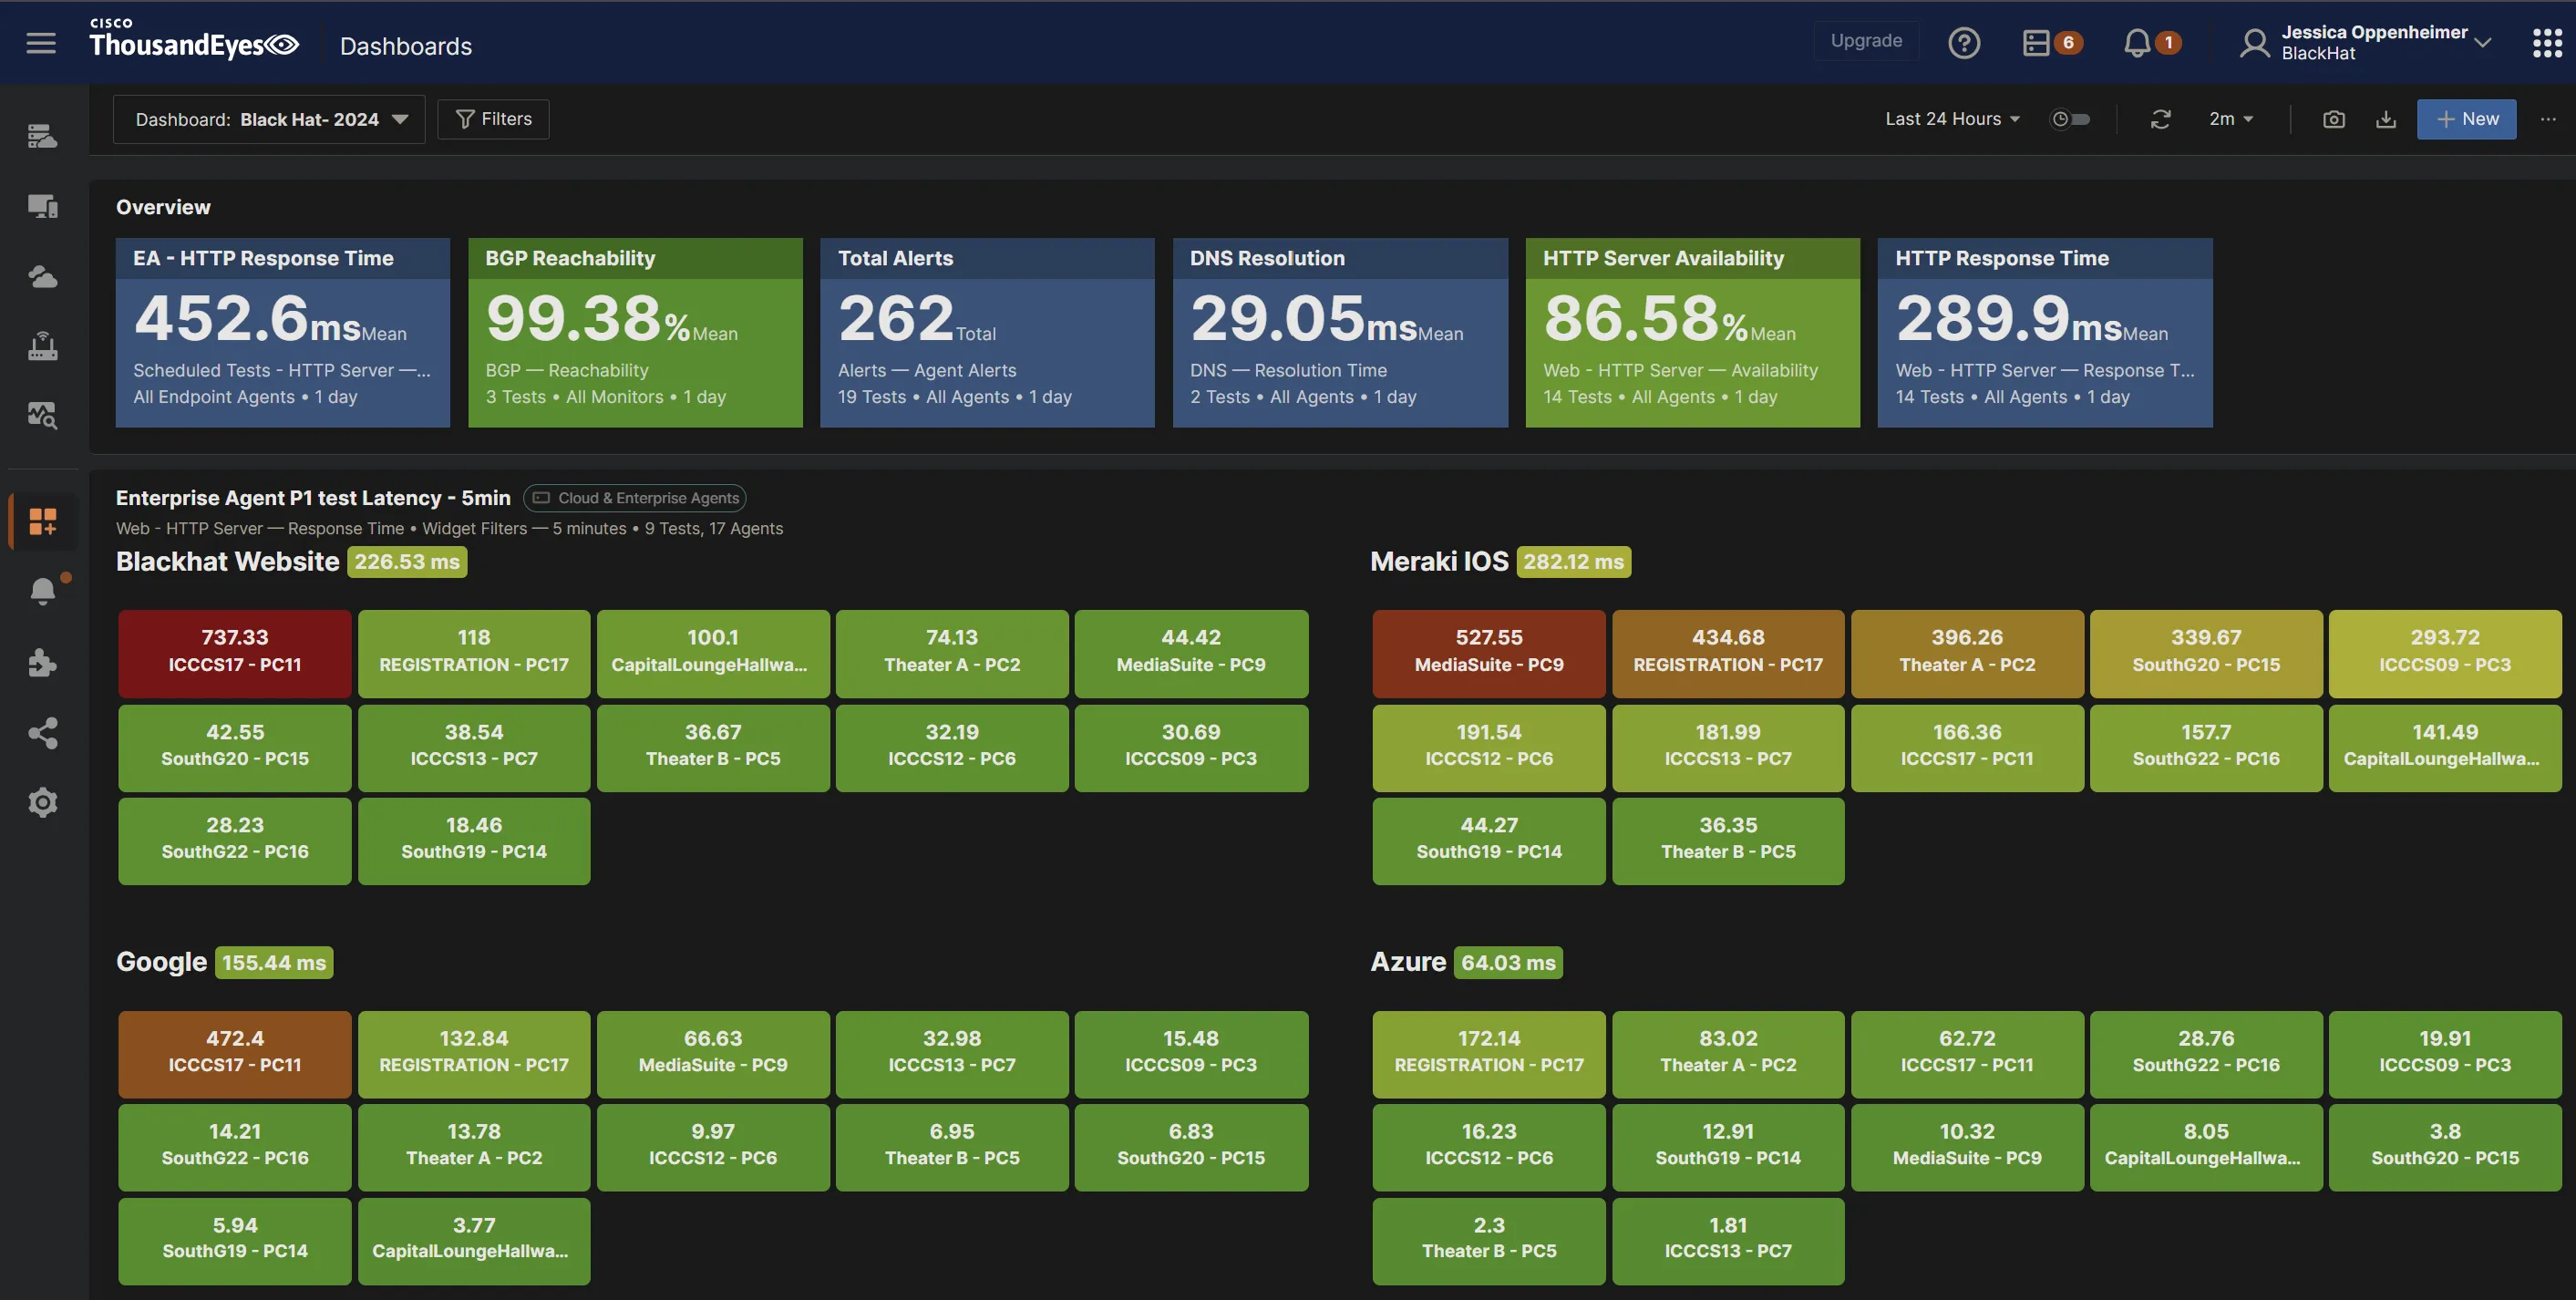
At Black Hat Europe 2024, we had a problem where the ThousandEyes agents were showing a high latency time to Azure. We were receiving calls about access to Azure being slow, but being the proactive NOC we are, we went ahead and investigated what is causing the high response time.
We investigated the Azure Network path that is recorded by ThousandEyes and found there are three destinations the Azure status portal uses.
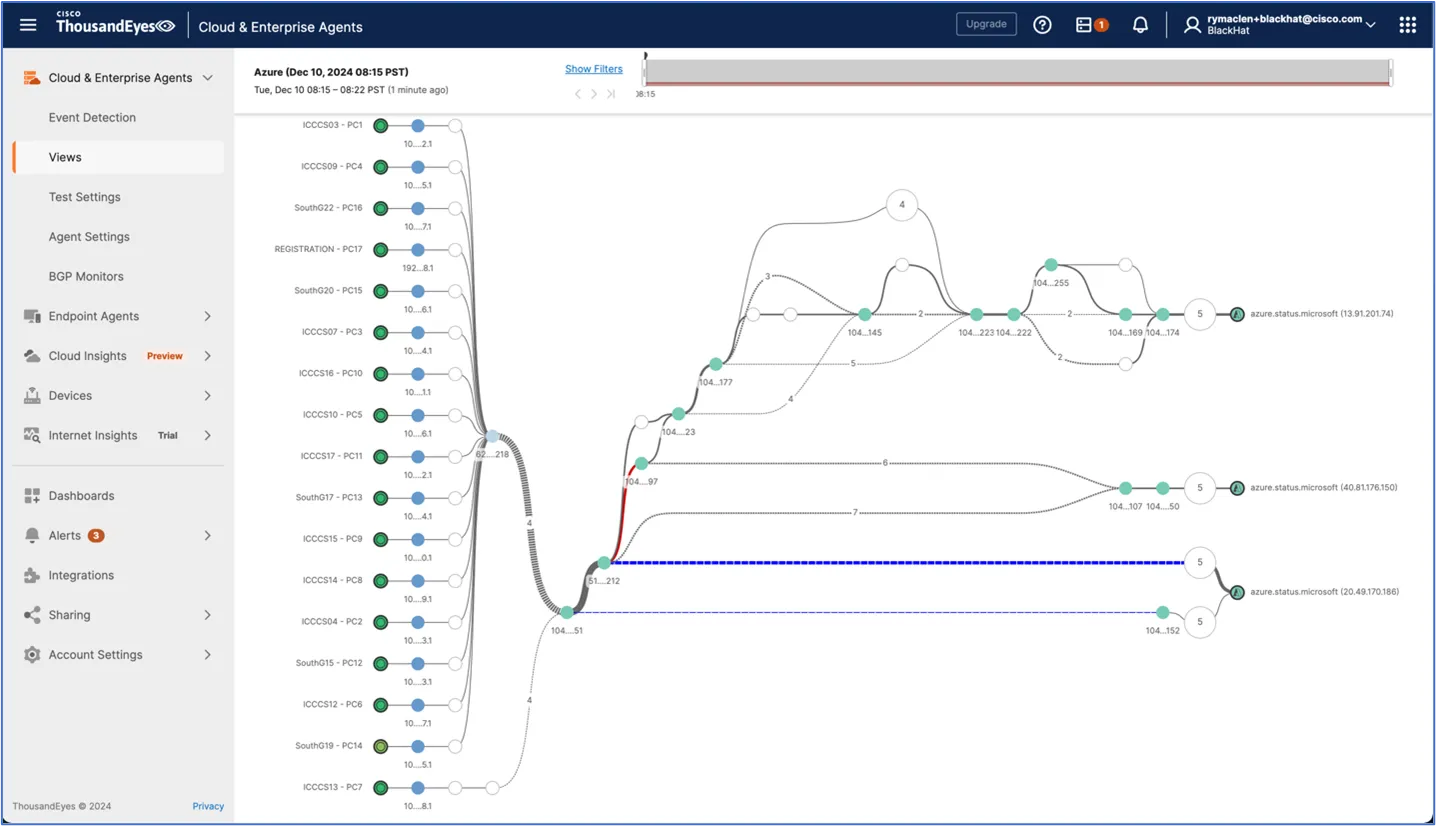
Two of those destinations are outside of the United Kingdom: one in the United States and one in Japan. If you look in the screenshot above, you can see a single red link and it can be used for either the US or Japan Azure status portal. This is the most likely cause for the increased response time we were seeing besides the geographic distance. Seeing this, we SSH'ed into one the ThousandEyes agents and used the HTTP'ing tool to do a similar test to Azure. When we ran the test to the Azure portal status page, we would see some normal response times and then many latent response times. This matched up to what ThousandEyes reported. This led us to the conclusion that the Azure status portal workload balances but does not do geographic load balancing.
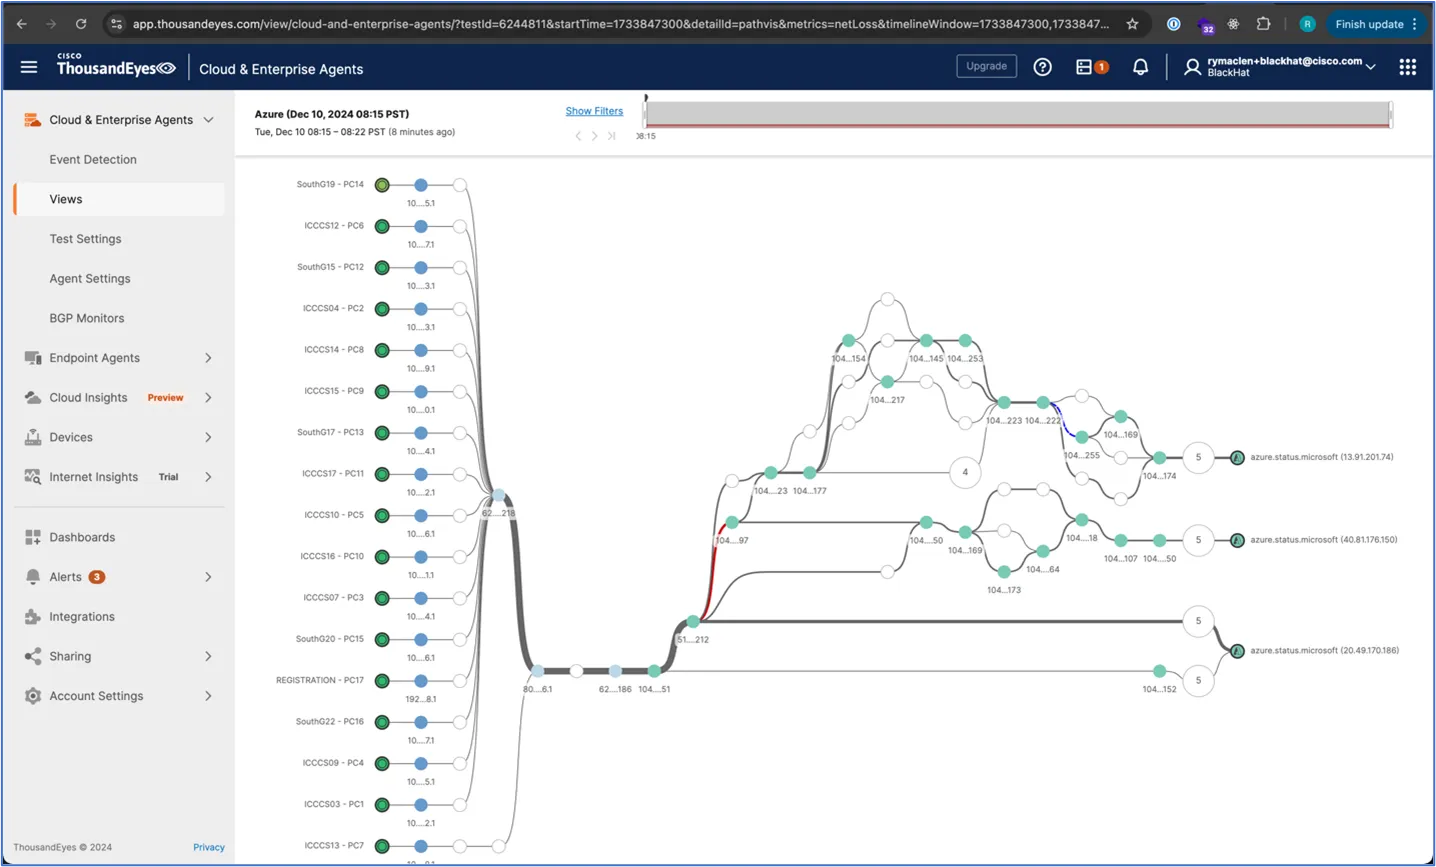
With this data, we decided to hard code the IP of the United Kingdom server into the ThousandEyes test to better represent how attendees will access Azure.
ThousandEyes is a very powerful tool, and it is able to determine whether the issue resides inside the network or outside where we cannot control it. Below is a screenshot of how many different network paths can take to a single resource. This shows the importance of being able to pinpoint exactly where an issue is taking place.
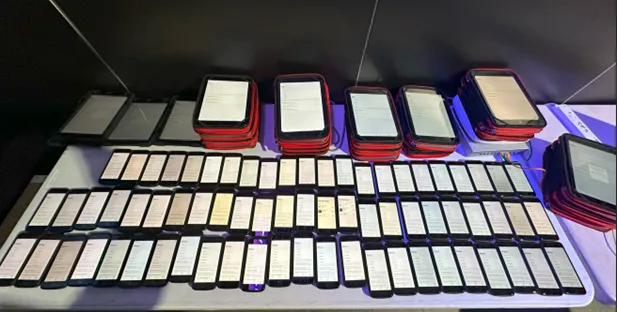
Our fourth year of deploying Meraki Systems Manager at Black Hat Europe, as the official Mobile Devices Management platform, went very smoothly. We introduced a new caching operation to update iOS devices on the local network, for speed and efficiency. Going into the event, we planned for the following number of devices and purposes:
We registered the devices in advance of the event. Upon arrival, we turned each device on.
The Wi-Fi profile that we need for the Black Hat iOS devices was not installed. However, I brought a Meraki Z3C, with cellular and Wi-Fi capability. I'd brought this because it normally takes a couple of days to get Wi-Fi down in Registration, where we set up the devices before deployment. So, within literally 15 seconds, I'd spun up a new SSID, prefixed it with a full stop so that it appeared at the top of the available Wi-Fi networks, and before the first iOS device had powered on, the Z3C was broadcasting this. So, with just a handful of seconds toil on each device, we'd got them connecting back to Meraki Dashboard to get the correct Wi-Fi profile.
Location services is a pain point for mobile device management. Firstly, you must ensure thatLocationPrivacyLocation
Location of devices is important for theft retrieval or if the device is misplaced. Location is enabled by opening theSystem Managerapp and tappingLocationEnableWhilst using the applicationAlways allow
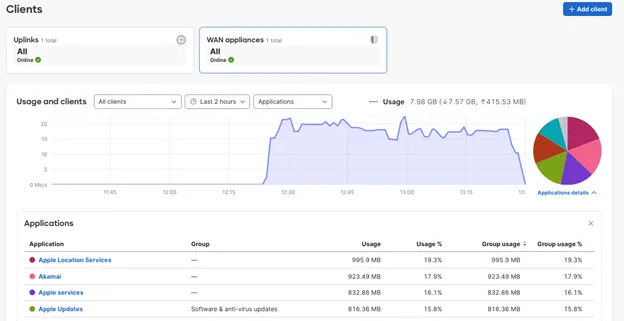
Below is a quick screenshot of the Z3C client dashboard after an hour of the devices being turned on.
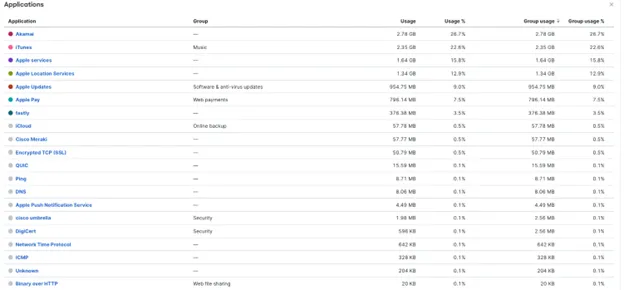
Interesting to see where the device is calling out to, in the screenshot below.
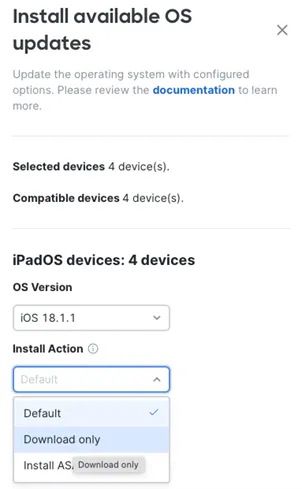
Having applications updated in the middle of an event can have disastrous consequences. Whilst there isn't an overall setting or restriction to prevent this, it is possible to do it at the application layer. And, of course, Meraki Systems Manager allowed us to do this for all apps at the same time.
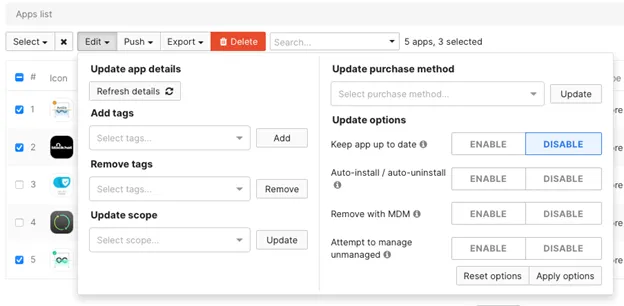
I think this goes without saying, but the ability to remotely update devices in the event of an urgent vulnerability fix is invaluable, like we had last year in Las Vegas with Apple.
The security of the Registration network is paramount as there is Personal Identifying Information data on this network. So, we have some pretty strict inbound and outbound rules.
Managing Apple devices requires that 17.0.0.0/8 be kept open for port 80 and 443 traffic. Furthermore, Meraki allows you to download a dynamically created list of servers that it needs to be open to so that endpoints can be managed. But, as we are using Cisco Umbrella and AMP (Secure Endpoint), there's a whole host of other endpoints that need to be opened. These are listed here.
One of the biggest problems affecting the iOS devices at past Black Hat events was the immediate need to both update the iOS device's OS due to a patch to fix a zero-day vulnerability and to update the Black Hat iOS app on the devices. At the USA events, there are hundreds of devices, so this was a challenge for each to download and install. So, I took the initiative into looking into Apple's Content Caching service built into macOS.
Now, just to be clear, this wasn't caching EVERYTHING... Just Apple App store updates and OS updates.
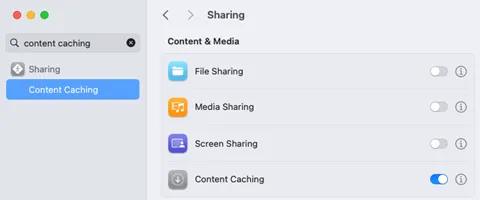
This is turned on withingSystem Setting
I'm not going to get into the weeds of setting this up, because there's so much to plan for. But I'd suggest that you start here. The setting I did change was:
 Горячие метки:
Зарегистрируйтесь по электронной почте сейчас для еженедельной акции акции
100% free, Unsubscribe any time!
Add 1: Room 605 6/F FA YUEN Commercial Building, 75-77 FA YUEN Street, Mongkok KL, HongKong Add 2: Room 405, Building E, MeiDu Building, Gong Shu District, Hangzhou City, Zhejiang Province, China
Whatsapp/ тел: +8618057156223 * телефон: *: 0086 571 86729517 Tel in HK: 00852 66181601
Электронная почта: [email protected]
 English
 Pусский
 Français
 Español
 Português