










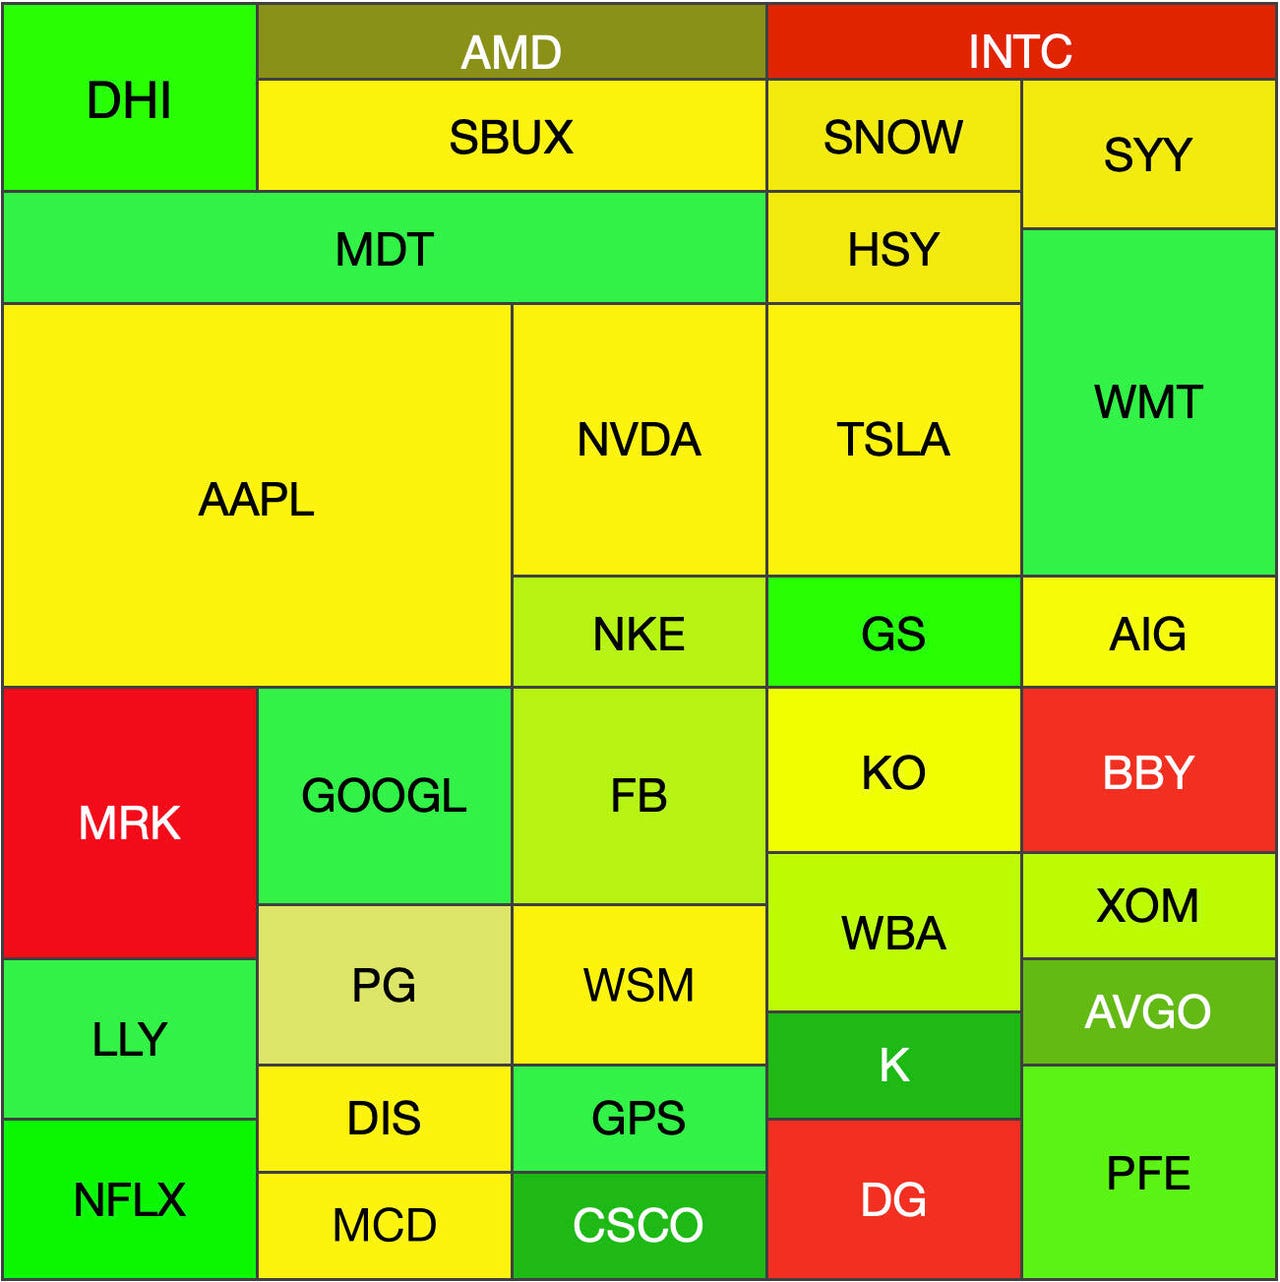
Stocks are more than a ticker symbol.If you understand a little bit about the financials behind the symbol, how a company reports its sales and profit, and its assets, you'll be light-years ahead of other investors. The market map above shows some of the most popular publicly traded companies based on market capitalization -- the market value of a company's outstanding shares. The sizes of the rectangles represent the relative market cap of the stock, while the colors represent the direction of the stock's share price: Green is up, yellow is unchanged and red is down.
Tiernan Ray for ZDNetDespite recent upticks, the stock market is still in the red in 2022.
The first half of the year has been the worst January to June for the Standard & Poor's 500-Stock Index since 1970. The index, which tracks the 500 largest publicly traded US stocks based on market capitalization, plunged into bear market territory, down 20.6%. The tech-heavy Nasdaq Composite Index, comprising the share prices of two thousand US-listed stocks, fared worse during the first half, down nearly 30%.
Tech stocks bore the brunt of the downturn, due in part to the effects of rising inflation (8.5% in July, down from June's four-decade high of 9.1%) and lower valuation.
Also:Financial stress among American workers is high
Many investors who have lost money in these market declines are loath to spend any more on stocks. And yet, a market downturn is a good time to consider stocks for three reasons:
ZDNet provides insights on specific financial factors from a company's financial statement that investors should consider when investing in quality stocks.
But first, a rundown on the basics.
Before getting into the how, let's talk about the what. What is investing? On a basic level, investing is buying an asset in the hope that it will appreciate in value over time and, in turn, the price of that asset will increase. Some people confuse investing with speculation; however, the two are different. When you speculate, you bet that the price of your investment will go either up or down, irrespective of the value of the underlying asset. Investing is more than speculation, as it factors an investment's asset's value as well as the price of the investment.
As a company improves its business, it gains more in value. Chip giant Nvidia (ticker symbol NVDA; share price$171.81), for example, has become more proficient at making chips for data centers and artificial intelligence over the past decade, and so its value as a company has appreciated dramatically. Nvidia is worth 58 times today what it was worth a decade ago. That's an annualized increase of 48.8%. It's like seeing your money be worth half again as much, every year, over the past 10 years. (Unless otherwise noted, share prices and related data are as of Aug. 23.)
Conversely, you may speculate that the cryptocurrency Bitcoin will rise or fall in price today, tomorrow, or next year, but rather than basing that on any underlying asset value in Bitcoin, you're likely just assuming its price will change one way or the other, perhaps based on popularity.
Think of a share of stock as a fraction of ownership of a company. When you buy stock in a public company, you become a partial owner of that company.
Owning stock means you have a stake in how well, or poorly, it performs. One share of Nvidia stock, for example, is a minuscule fraction of the total value of the Silicon Valley-based tech giant. Nvidia has 2.5 billion shares issued (or outstanding). Therefore, buying one share means you own a tiny fraction of the company. Although buying more shares increases your proportionate ownership, you would need to buy 25 million shares of stock to own just 1% of Nvidia. And at$171.81 per share, that would cost you$4.3 billion. But don't worry, you will see the same percent increase or decrease in your money as any other holder, so buying even one or two shares, regardless of the percentage ownership, brings the same benefit.
Because you've become an owner of a company, it's important to keep consistent tabs on the performance of the company to know whether its business is improving or degrading. While there are many free data sources available on the internet to look at a stock's performance, such as Yahoo Finance, you can't fully appreciate what those numbers mean unless you first understand where they come from.
Most of the numbers that appear on a Yahoo Finance stock page are derived mainly from company financial statements. The majority of stocks listed are publicly traded companies and are required by the Securities and Exchange Commission to report such information on a quarterly, semiannual and annual basis.
When evaluating the performance of a company, you need to understand the three statements that illustrate the business activities and financial performance of a company: the income statement, the statement of cash flows, and the balance sheet. Master your knowledge of these three statements, and you will be equipped to understand the nuances of a company's operation, value, and future potential to determine if it's worth investing in.
The point of evaluating performance in this way is to know whether a company is going in the right direction, similar to how you would track fitness goals to measure whether you're exercising productively.
Also known as a "P&L" for profit and loss, the income statement tells you how much revenue a company generates: in other words, how many products and/or services it sells, and how much profit it makes from those sales. Generally, profit is an indicator of a company's value, and how it can become more valuable over time.
Investors will look for different things in an income statement depending on the industry of the company and how it operates. For example, a fast-growing, young tech company such as cloud software vendor Snowflake (SNOW;$153.07) has high relative revenue growth compared with an older, more established company such as Oracle (ORCL;$76.41), on the order of 98% in the most recent 12-month period ended in April, compared with 5% growth for Oracle in the most recent 12 months.
Many investors believe that the best way to tell if a young company is performing as it should -- that is, gaining value -- is for it to have relatively high revenue growth, higher than most S&P 500 companies, which is what Snowflake has. The S&P 500 companies have had an average growth rate of 6.7%, annually, over the past five years. However, Snowflake has lost money, so some investors will instead look for companies that may not increase sales as fast but that have high profit, as expressed in their profit margins. Apple (AAPL;$167.23), for example, is increasing revenue at only 11.5% a year, but Apple makes$6 a share in earnings, according to data from FactSet.
Once you know these numbers you can come up with very basic measures of the value of a stock. Two common measures are to divide the company's sales by the number of shares of stock, to get a figure for sales per share, and then divide that number into the stock price, to get what's known as a price-to-sales ratio. Similarly, the price divided by the earnings per share, known as price-to-earnings ratio, or P/E ratio, tells you how much the company is valued, as measured by its current share price relative to its earnings per share.
As you can see in the accompanying FactSet table, although Snowflake is growing much faster than Apple, its price-to-sales ratio is several times higher, 34 versus 7. Higher means more expensive: You're paying much more for a dollar of sales for Snowflake than for Apple.
In the case of profit, because Snowflake is losing money, you could say it has a negative P/E, but really, it doesn't have a relevant P/E because you can't have a negative divisor. Usually, Snowflake's P/E would be indicated by "N/A" on a financial summary, as in the accompanying table, for "not applicable." Apple, on the other hand, trades at about 30 times its profit per share. Snowflake doesn't have any profit to support its stock price, while Apple's P/E ratio is richer than most stocks -- the Standard & Poor's 500 index's average P/E is 17.8 -- but probably justified given Apple makes a ton of money in absolute dollar terms.
Most recent 12-month period.
FactSetRevenue and P&L aren't the only measures of valuation. The company's cash flow statement gives additional insight in two respects: real cash profits and dividends.
When people talk about real cash profits, they talk about forgiving a company for such items that reduce its profit that are accounting phenomena but not actual cash expenses. The biggest one is stock options, which is the way that many companies pay their employees, especially young tech companies. Although stock option expenses need to be recorded in the company's income statement, the company hasn't actually paid anything for them; it's just an accounting formality. (For years, people have argued that stock option expense is a real expense and should be considered as such, but that debate is beyond the scope of this article.)
Take, for example, the software manufacturer and cloud services company Splunk (SPLK;$108.24). It had negative net income in the most recent 12-month period of$1.17 billion. It would be like Snowflake on a valuation basis, having an unrealnegativeP/E ratio.
However, a large amount of that loss was attributed to stock options, to the tune of$605 million. When one removes that amount from the equation, among other items, Splunk has positive operating cash flow of$201 million. From operating cash flow, investors will next subtract the real cash cost of major purchases, such as equipment or property, known as capital expenditures, to arrive at what's calledfree cash flow -- the ultimate measure of profit for some investors, especially tech investors.
After subtracting capital expenditures, Splunk turns out to have a real cash profit of$188 million, or$1.16 per share for the 12-month period. Remember that price-to-earnings ratio? Instead of using net income per share in that equation, we can use the$1.16 as the denominator.
On that basis, Splunk appears more reasonable, with a ratio of price divided by free cash flow of 93. That's not particularly cheap, but it is a lot different from the the negative P/E one would get from the income statement.
Another important item from the cash flow statement used to value companies is dividends, the cash that some companies pay out to shareholders, usually quarterly, for every share an investor owns. Dividends can be an important factor to consider when companies don't appear as rich on a cash basis.
For example, retail giant The Gap (GPS;$10.10) isn't nearly as profitable as Splunk based on free cash flow. In fact, in the most recent 12-month period, Gap reported negative free cash flow of$1.90 per share when factoring in capital expenses. That's not so surprising, considering that Gap has to spend on building stores, something that software makers generally don't need to worry about.
But, Gap pays dividends, which Splunk doesn't. Gap paid 12 cents per share every quarter of the most recent 12-month period, or$191 million in total. You actually got paid 48 cents a share over 12 months to just hold onto Gap stock. Multiply that by hundreds or thousands of shares, and you can make real money as a partial owner of Gap. That's why investors like to know how much income a stock offers by knowing its dividendyield.
To calculate dividend yield, divide the company's market cap by the amount paid in dividends, that$191 million in Gap's case. You now have a dividend yield of 5%. That's one of the highest dividend yields of all the companies in the S&P 500, the average of which is a yield of just 1.5%.
Most recent 12-month period.
FactSetThe balance sheet tells you how much a company has in assets, such as cash, the investments it holds, and also items such as receivables -- money it's due to receive from customers. It also tells you how much the company has in debt. The "balance" in balance sheet is the comparison of assets to debts.
A couple of very important aspects of a business can be gleaned from the balance sheet. The first is the current ratio, also known as the working capital ratio. Working capital is the money a company has on hand to cover its obligations. It's an exercise in asking, If a company stopped making money today, would it have enough assets to cover what it has to pay out? A company with a higher current ratio has a stronger balance sheet, and is better able to cover its obligations.
The current ratio is calculated by dividing current assets by current liabilities. Among the highest current ratios of all S&P 500 companies is home builder D.R. Horton (DHI;$72.86). It has a current ratio of 4.9. That makes sense, given that Horton has a lot of value in current assets locked up in what's known as inventories, items such as construction in progress and land, both developed and undeveloped. Those are assets that help offset its obligation to deliver homes.
On the other hand, a company such as discount chain Dollar General (DG;$248.73) has among the lowest current ratios, at about one times current assets to current liabilities. Dollar General has very little cash, with most of its assets being merchandise it holds in its stores. At the same time, it owes a large amount in any given period to the suppliers of its merchandise, and the two things just about cancel each other out. You could conclude that Dollar General operates with much less of a cushion than Horton.
Another important finding from the balance sheet is what's known as a company'senterprise value. Remember our market capitalization that we mentioned above? That's normally used as the total value of a company if you added up all of its shares. But if a company has a lot of cash, or a lot of debt, you'll need to adjust market capitalization to reflect that.
A company with lots of cash is less expensive than its share price alone would suggest, because you're getting a share of that big cash pile with every share of stock you buy. Conversely, a company with a lot of debt will be more expensive than share price alone would suggest, because you're taking on the responsibility of that debt with every share you buy.
To find enterprise value, take the market cap and subtract the dollar amounts for cash, and add the dollar amounts for debt. Take D.R. Horton again as an example. In late July the company had a market capitalization of$25 billion. But because it has more debt than cash --$4.26 billion versus$1.68 billion -- its enterprise value, at$27.8 billion, is higher than its market cap of$25 billion by more than$2 billion. Horton is more expensive when you calculate enterprise value.
Dollar General, with considerably more debt than cash, has an even bigger gap between its market capitalization and its enterprise value -- it's way more expensive on the latter basis than you'd think from just checking stock price.
Enterprise value adds sophistication to valuation analysis in other ways. Remember our price-to-sales and price-to-earnings from the income statement? An investor who wants to be more sophisticated than average will look beyond those two metrics. They will take enterprise value and use that number instead of market capitalization to divide by sales or by earnings. The ratio is no longer price-to-sales, it's now "EV-to-sales" or "EV-to-profit." You can also combine enterprise value with our discussion of free cash flow from the cash flow statement, and arrive at "EV-to-free-cash-flow," and really be sophisticated.
For example, Apple, you'll recall, has a P/E of 30, more expensive compared with its S&P 500 brethren. But, with almost$179 billion in cash and investments, Apple has more money than most entities on the planet. If you want to be really sophisticated, you'll use Apple's enterprise value, which takes into account that cash, and divide it by the company's trailing 12 months of free cash flow. On that basis, Apple has an EV-to-free-cash-flow of 25 -- still pricier than the S&P, but not as much of a premium as it appeared based on straight P/E.
In this way, if someone tells you something looks cheap, you may want to ask what it looks like when EV is used, to reflect whether cash or debt affects the valuation.
Most recent 12-month period.
FactSetThe good news is that you don't have to be a Wall Street broker to calculate and understand all of these metrics yourself. You can use free financial sites such as Yahoo Finance to look up ratios such as price-to-earnings, price-to-sales, EV-to-free-cash-flow, and other basics such as market capitalization and the amount of debt.
There are several ways to use the metrics illustrated in this article, and different types of investors will give more consideration to some metrics than to others. All of that constitutes the art of stock picking. But if you can get your head around the basic concepts discussed here, you will have taken sizable strides along the road to investing and you will be much savvier than the average investor.
The information presented by ZDNet is not intended to be individual investment advice and is not tailored to your personal financial situation. It does not constitute investment, legal, accounting, or tax advice, nor a recommendation to buy, sell, or hold any particular investment. We encourage you to discuss investment options with your financial adviser prior to making any investments.
 Горячие метки:
Инвестиции в целях развития